Fig 4.
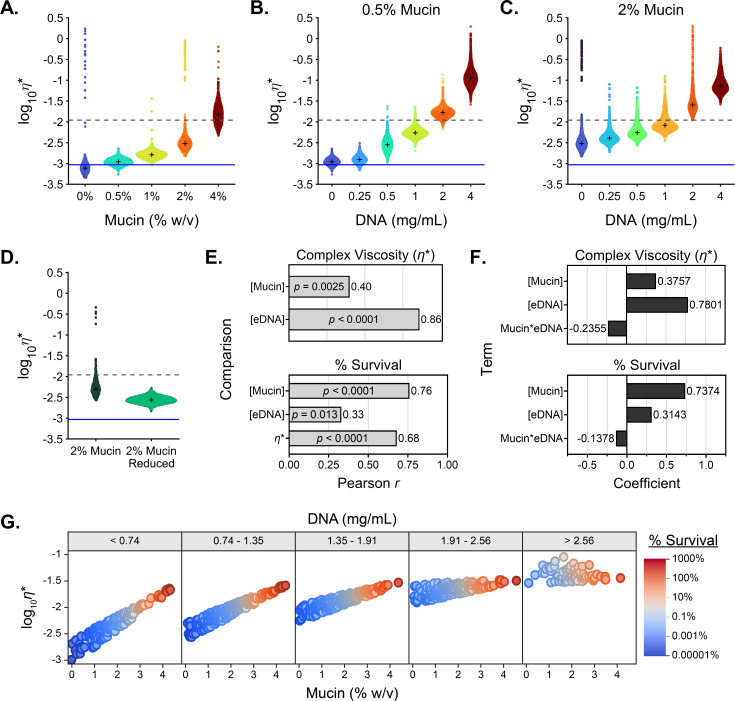
Biopolymer concentration drives viscoelasticity but does not fully explain tobramycin tolerance. (A–D) Modulus of the complex viscosity (η*) of a 1 µm diameter microsphere moving through (A) SCFM2 with increasing concentrations of mucin (% wt/vol) without eDNA, increasing eDNA concentrations (mg/mL) in (B) 0.5% and (C) 2% (wt/vol) mucin SCFM2, or (D) 2% mucin SCFM2 before and after mucolytic reduction. Data are representative of n ≥ 3 technical replicates. The viscosity of water is indicated by the solid blue line and the complex viscosity at which mucus entangles and becomes gel-like (42) is indicated by the dashed gray line. + indicates the median for each sample. (E) Multivariate correlation of viscoelasticity to mucin and DNA concentration, and survival to mucin, DNA concentration, and viscoelasticity, represented by bar graph of Pearson’s r with the corresponding P-value within each bar. (F) Centered and scaled coefficients for the X variables used for partial least squares regression in modeling viscoelasticity and survival to tobramycin. (G) Visualization of the simulation results via grouped dot plots.

