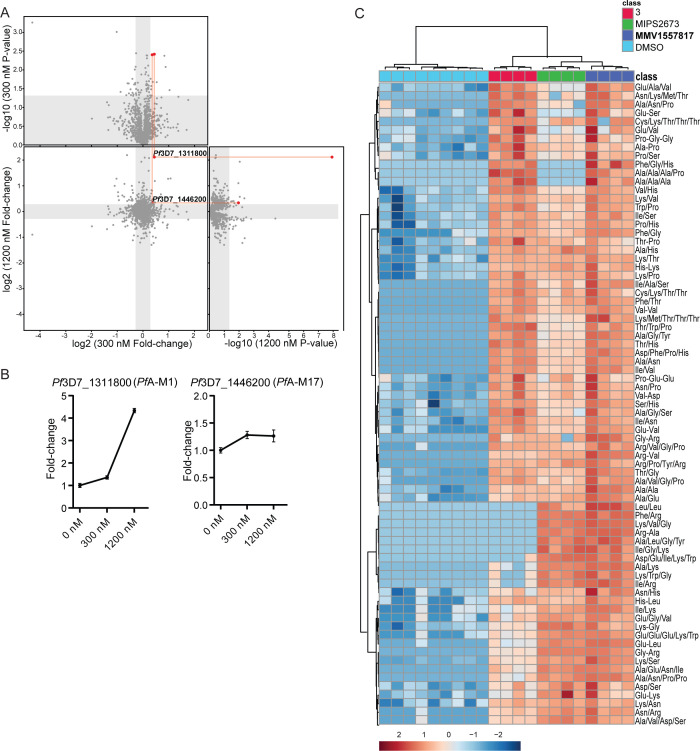
Fig 4.
Thermal proteome profiling of MMV1557817 confirms PfA-M1 and PfA-M17 as compound targets. (A) Paired volcano plot of all proteins detected. The outside panels show the log2 fold change vs –log10 P value of proteins following treatment with 300 nM or 1200 nM of MMV1557817, relative to the 0 µM negative control, following a 60°C thermal challenge. The thermal stability of both PfA-M1 (Pf3D7_1311808) and PfA-M17 (Pf3D7_1446200) were altered at both concentrations with a P value < 0.05 as determined by Welch’s t-test, with increasing stability in increasing concentrations. PfA-M1 and PfA-M17 are highlighted with red lines and dots. No other proteins were significantly stabilized by both drug concentrations. (B) Protein intensity of Pf3D7_1311808 (PfA-M1) and Pf3D7_1446200 (PfA-M17) in increasing concentration of MMV1557817 and following 60°C thermal challenge. Value represents the mean of two biological replicates performed with ≥3 technical replicates ± standard deviation. (C) Hierarchical clustering of the 73 significantly perturbed peptides (P value < 0.05) following treatment with MMV1557817, MIPS2673 (PfA-M1 inhibitor [53]), 3 (PfA-M17 inhibitor [7]), and DMSO control. Vertical clustering displays similarities between samples, while horizontal clusters reveal the relative abundances of the 73 peptides from four to seven biological replicates. The color scale bar represents log2 (mean-centered and divided by the standard deviation of each variable) intensity values. Peptides with hyphen notations indicate confirmed sequence by MS/MS. Peptides with slash notation indicate putative amino acid composition (accurate mass), without confirmed sequence order.

