Fig 5.
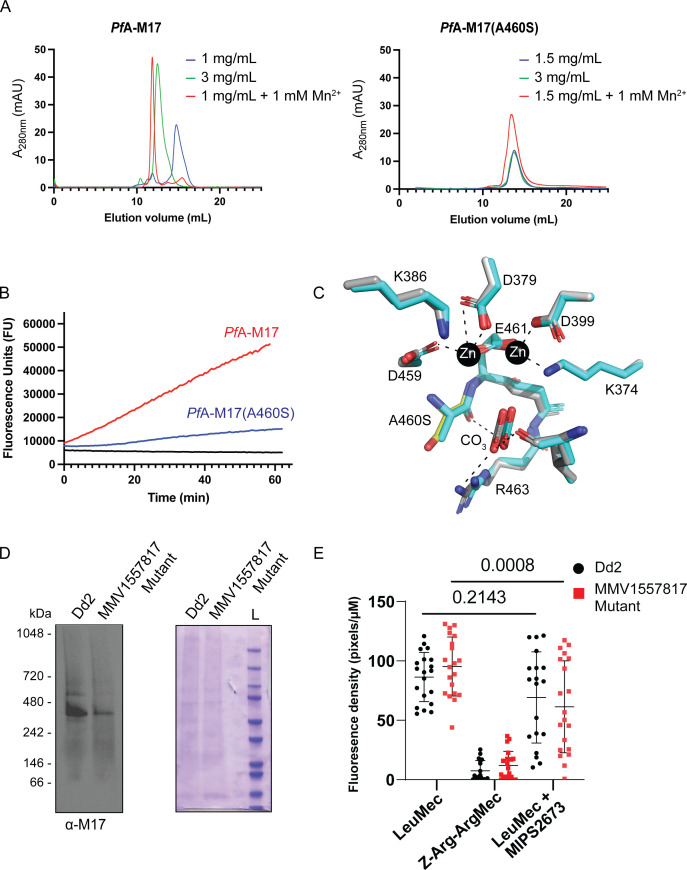
Characterization of PfA-M17(A460S). (A) Size exclusion chromatography of recombinant wild-type PfA-M17 (left) and mutant PfA-M17(A460S) (right) showing that the shift to the functional hexameric species does not occur in the mutant as readily as wild-type. Concentration of recombinant proteins analyzed is indicated, as is the presence of metal ions that has been shown to shift the oligomeric equilibrium. (B) Activity assays comparing recombinant wild-type (red) at 300 nM to A460S mutant (blue) at 10 µM. Aminopeptidase assay is indicated by an increase in fluorescence units (x-axis) over time (y-axis). (C) X-ray crystal structure of the active site of A460S (grey sticks) shows little change compared with wild-type (cyan sticks) in zinc-coordinating residues nor interactions with the carbonate ion (labeled), required for activity. The mutation position S460 is shown as a yellow stick. Interactions are shown in dashed lines. (D) Western blot analysis of blue-native PAGE performed on trophozoite stage Dd2 or MMV1557817-resistant parasites solubilized in 0.25% Triton X-100 reveals the presence of a PfA-M17-specific species representative of the native homohexamer (left panel). The expected size of the hexamer is 408 kDa, and each lane contains 10 µg of protein. Protein loading was confirmed by Coomassie stain (right panel). (E) Quantification of fluorescent density of proteolytic cleavage by PfA-M1 and PfA-M17 in Dd2 or MMV1557817-resistant parasites via live cell imaging with or without PfA-M1 inhibition by MIPS2671. Z-Arg-ArgMec serves as a negative control. Plotted is the mean ± standard deviation, and significance was determined using a one-way ANOVA Dunnett’s test.

