Figure 1.
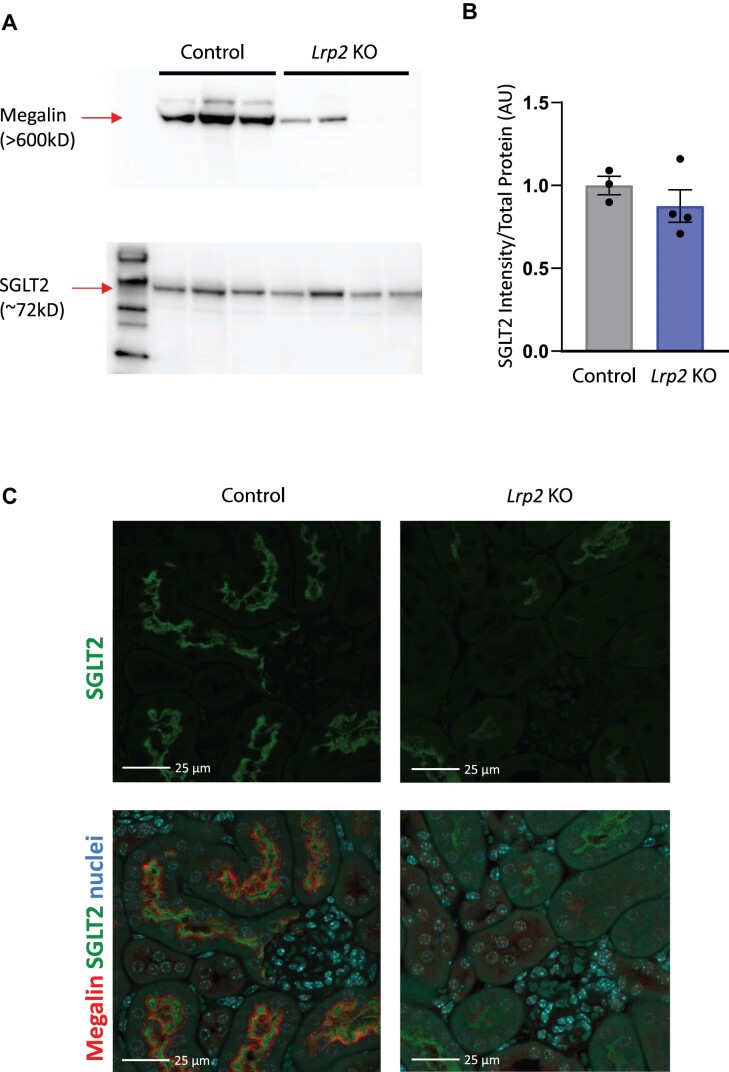
Lrp2 KO mice have reduced levels of SGLT2. Western blot (A) of mouse kidney lysates from control and Lrp2 KO male mice on regular chow probed to detect megalin and SGLT2. (B) Quantitation of SGLT2 expression in panel A. Data analyzed by an unpaired t-test. (C) Cortical kidney sections of control and Lrp2 KO mice were stained to reveal SGLT2 (green). Merged panels below each image show megalin (red) and nuclei (blue) to verify efficient KO. SGLT2 exposures and processing were identical for all images. Megalin staining intensity in the Lrp2 KO image was selectively enhanced to enable better comparison of expressing versus non-expressing cells. Scale bar: 25 µm.

