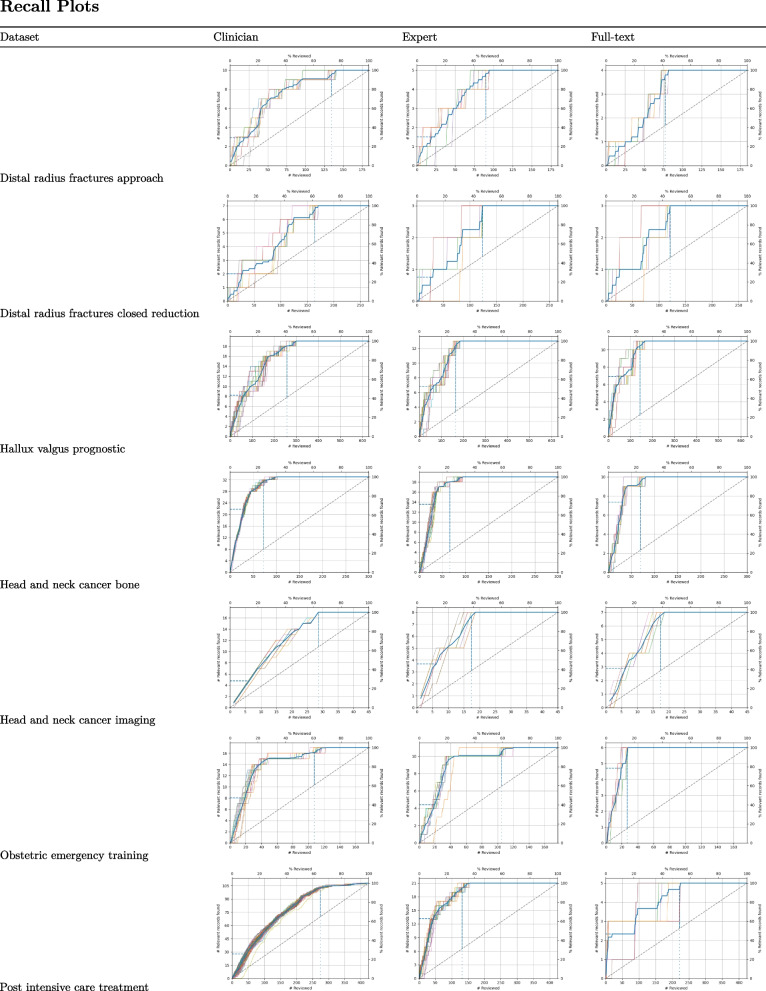
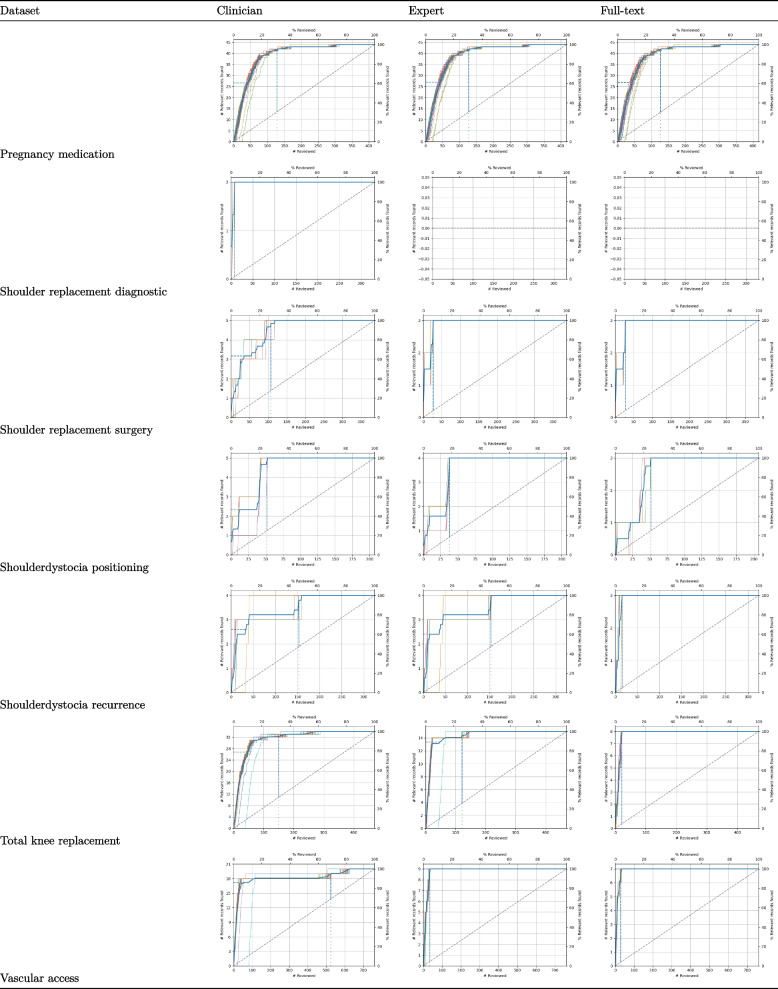
Fig. 1.
Recall plots of the simulated datasets. The first row indicates the number of relevant records found for each simulation run as displayed as a function of the number of records screened for each of the three levels (clinician, guideline methodologist, final decision). The vertical line indicates when 95% of the relevant records have been found. The Y-axis presents the number of relevant papers minus one paper selected for training data. Note that the simulation for the dataset Shoulder_replacement_diagnostic shows no recall lines because only one relevant paper was included, and at least two relevant records are needed for a simulation study


