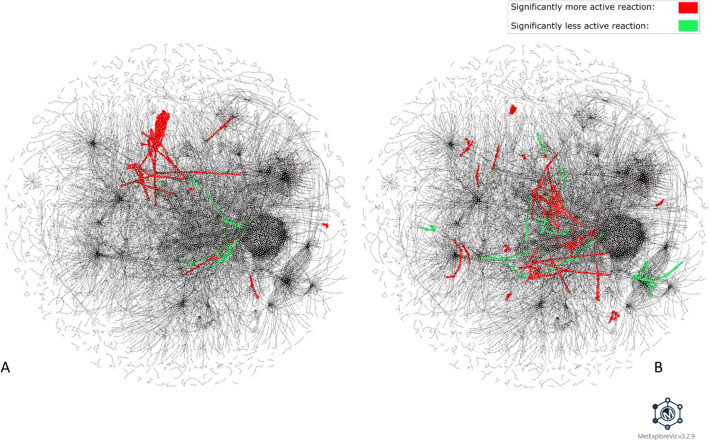
Fig. 3.
Visualization of DARs identified for amiodarone and valproic acid within the Recon2.2 metabolic network. This visualization was performed with MetExploreViz while removing side compounds (S4 Table). DARs identified for amiodarone (7 µM, 24 h) are highlighted in panel A and DARs identified for valproic acid (5000 µM, 24 h) are highlighted in panel B, with more frequently active reactions in the exposed versus control condition colored in red and less frequently active reactions in green. Nodes represent reactions and metabolites and are connected if a metabolite is a product or a substrate of a reaction. The two figures are based on the same network layout; thus, each reaction and metabolite is located at the same coordinates, allowing visual comparison. Interactive visualizations can be accessed through the following links: https://metexplore.toulouse.inrae.fr/userFiles/metExploreViz/index.html?dir=/5b6c886c4916c1de9e6c16a776cc6d64/networkSaved_1726726315 and https://metexplore.toulouse.inrae.fr/userFiles/metExploreViz/index.html?dir=/5b6c886c4916c1de9e6c16a776cc6d64/networkSaved_1522683843. The same visualization, with DARs colored according to their cluster’s group rather than their activity status, is also provided as supplementary material (S4 Fig)

