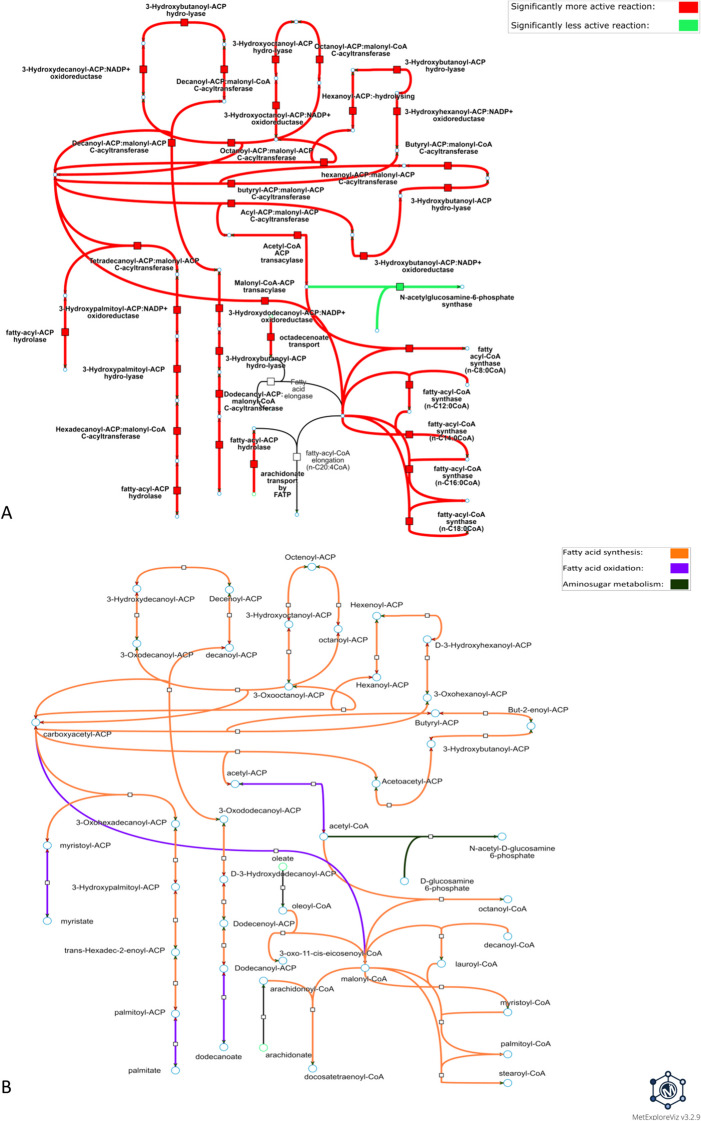
Fig. 6.
Metabolic visualization of the subnetwork extracted from one the DARs cluster predicted for amiodarone. DARs were predicted by performing condition-specific reconstructions for PHH exposed to 7 µM amiodarone for 24 h. The visualized subnetwork was computed with DARs from cluster #2, which is the cluster with the highest DARs subnetwork coverage among the clusters identified in the distance matrix (Fig. 4A) for this condition. Nodes represented by a square are metabolic reactions and nodes represented by a circle are metabolites. A and B represent the same subnetwork with the same topology. Links in A are highlighted according to the direction of the perturbation (e.g., if the reaction is more frequently active in the exposed condition vs. control condition) and links in B are colored according to the metabolic pathway of the associated reaction. Interactive visualizations can be accessed through these links: https://metexplore.toulouse.inrae.fr/userFiles/metExploreViz/index.html?dir=/5b6c886c4916c1de9e6c16a776cc6d64/networkSaved_373423088 and https://metexplore.toulouse.inrae.fr/userFiles/metExploreViz/index.html?dir=/5b6c886c4916c1de9e6c16a776cc6d64/networkSaved_725935955

