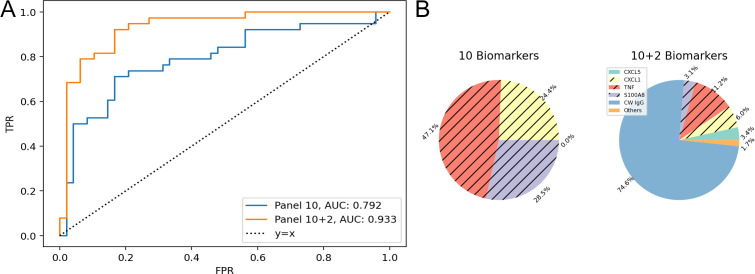
Fig 5.
Feature importance analysis for classification between progressors and controllers using cytokine, chemokine, and anti-M. tuberculosis antibody measurements. (A) Receiver operating characteristic (ROC) curve comparison of the 10-biomarker panel (blue) and 12-biomarker panel (orange) for the progressor vs controller comparison. (B) Percent Importance of the different biomarkers in two panels. Logistic regression is the classifier and importance scores averaged over 30-fold. Biomarkers corresponding to the unhatched colors are associated with longer survival and vice versa for the hatched colors. Biomarkers with less than 1% importance are omitted. The feature scores for other comparisons are shown in Fig. S1 and S2.

