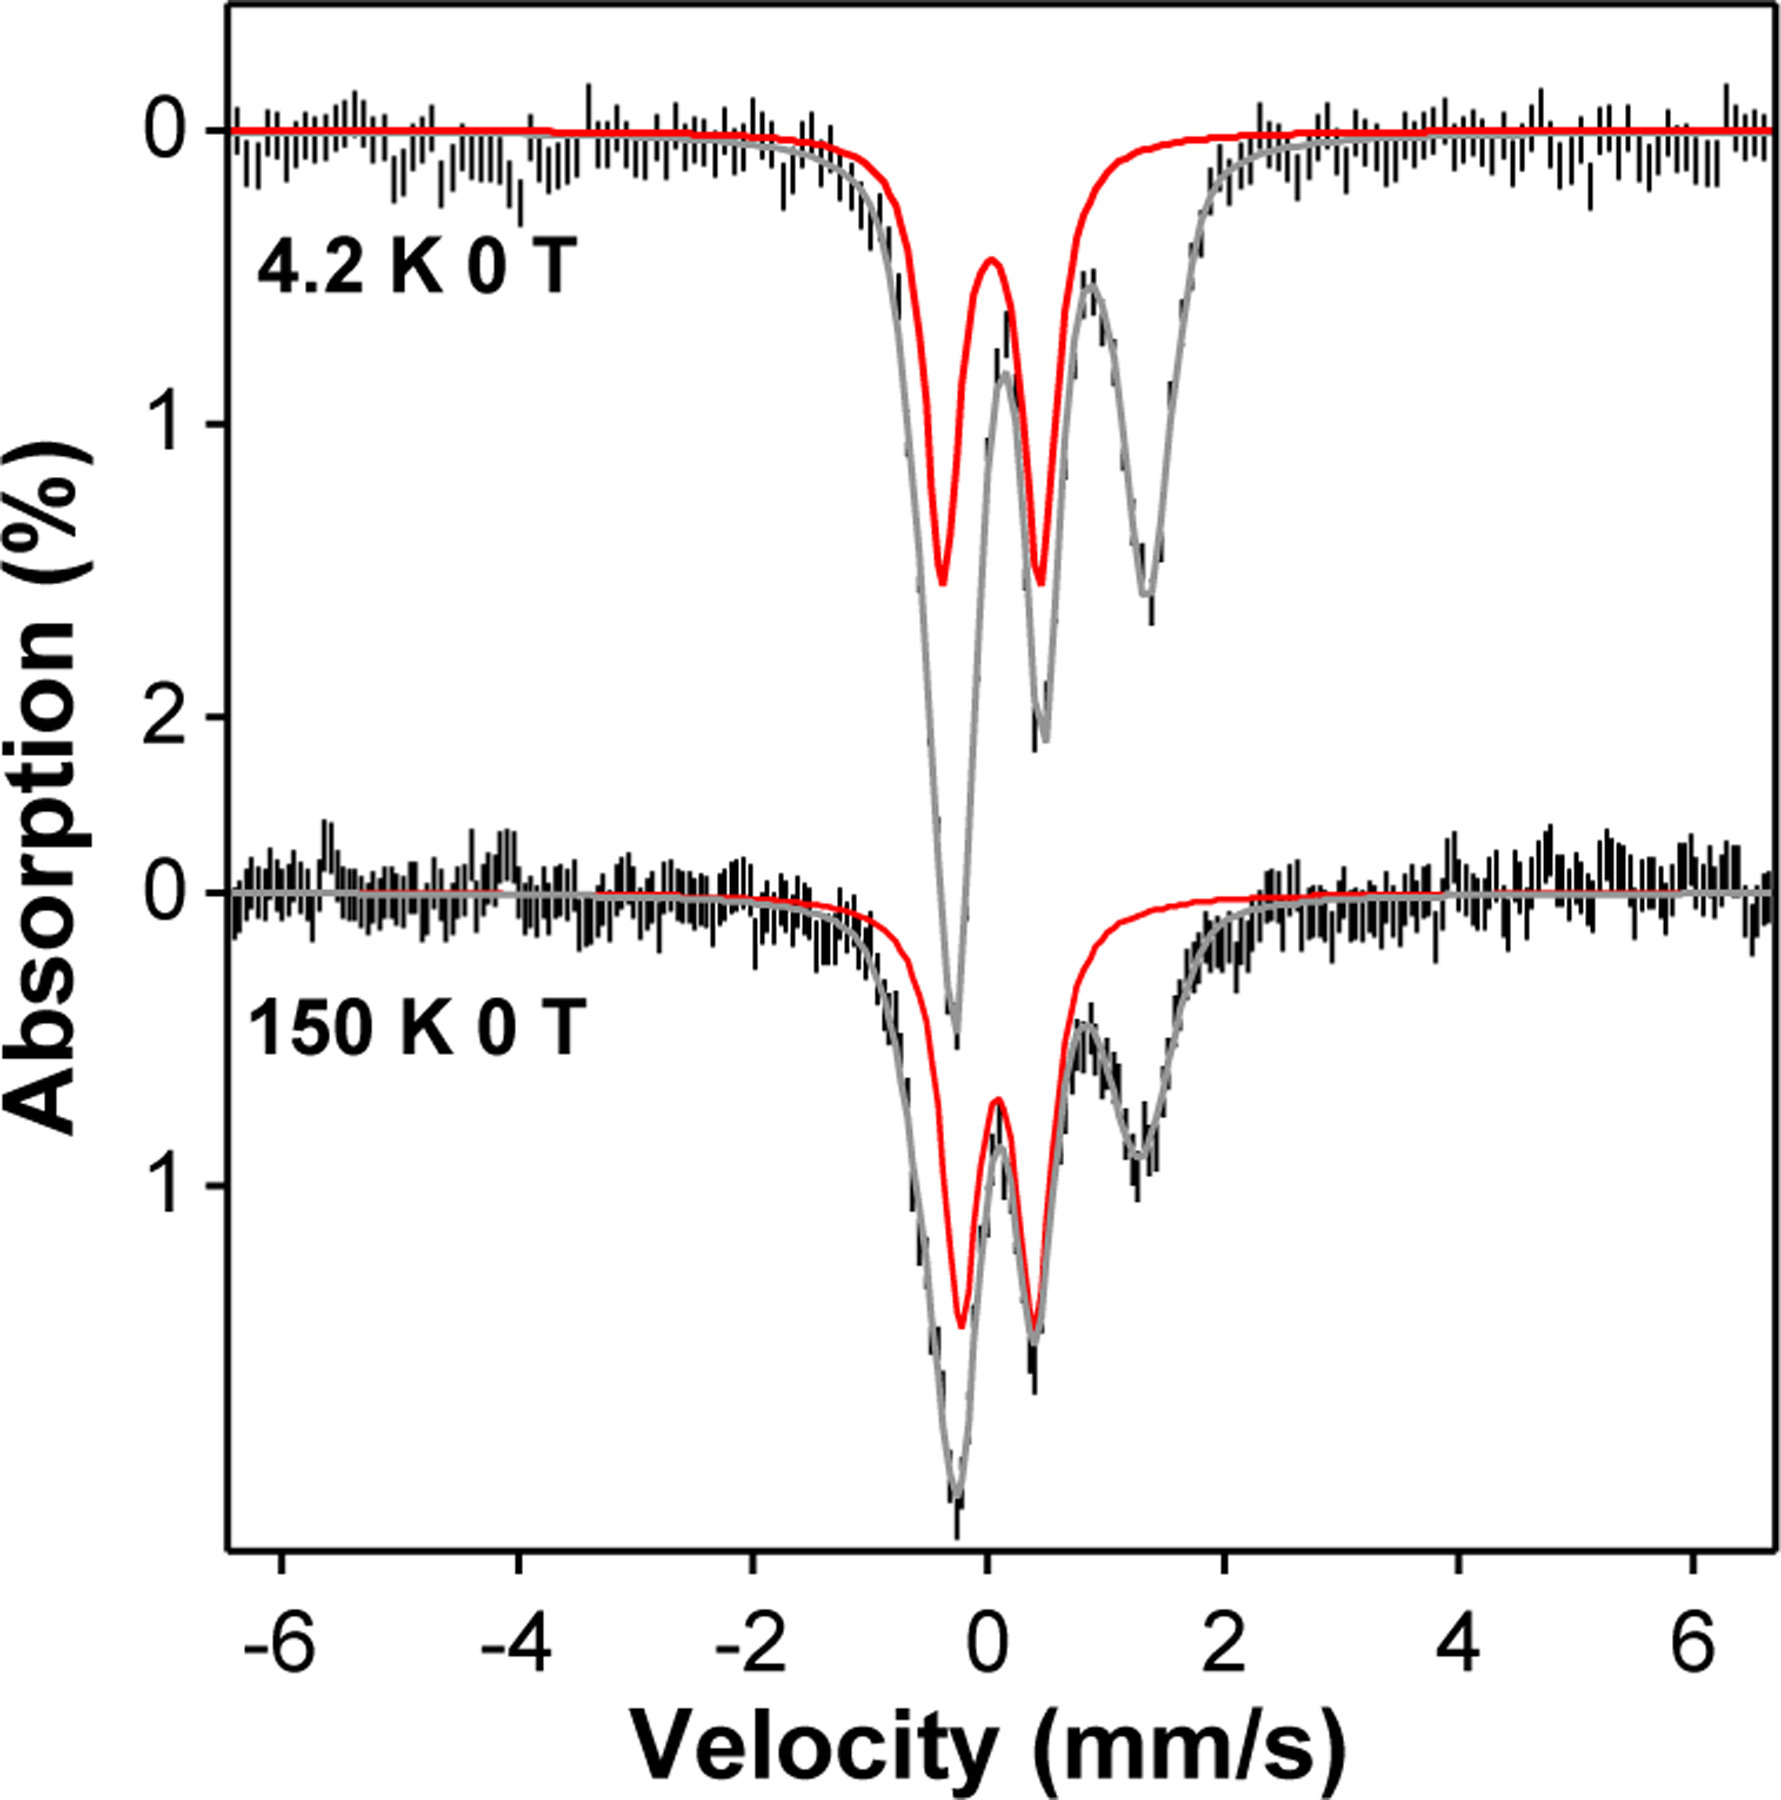
Figure 2.

Zero field Mössbauer spectra of the sample containing complex 2 measured at 4.2 K and 150 K. The experimental data are shown as the vertical black bars, the overall simulations of the spectra are shown as the grey solid lines, and the spectral simulations of 2 are indicated as the red solid lines, which represents ~ 40 % of the total iron in the sample The simulation parameters are listed in Table S8.
