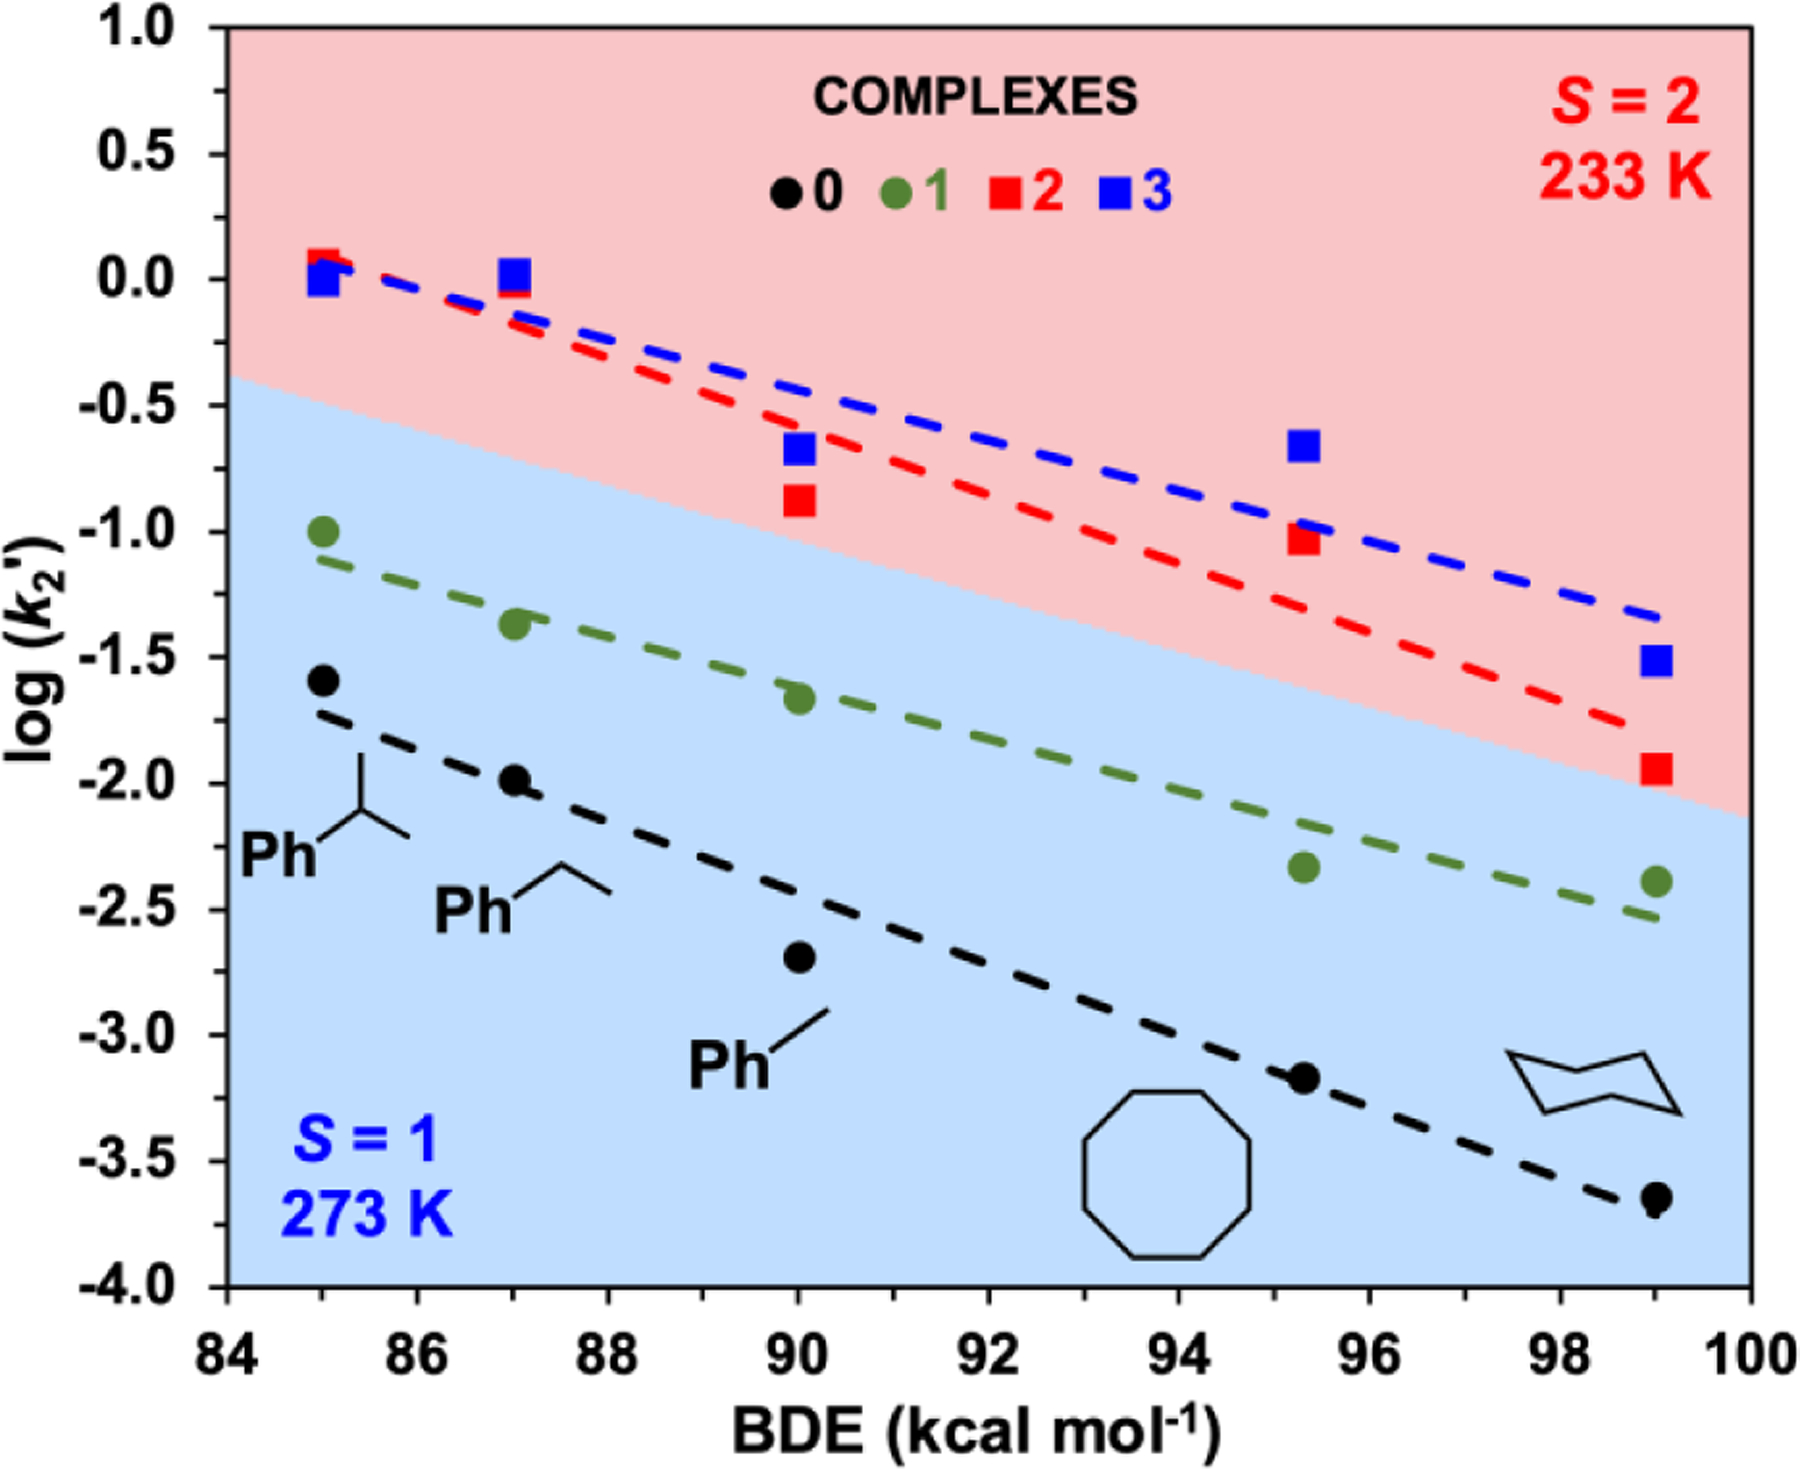
Figure 4.

Evans-Polanyi plots for 0 and 1 (k2 at 273 K) and for 2 and 3 (k2 at 233 K) in MeCN. The 40 K drop in reaction temperature would be expected to decrease reaction rates by about an order of magnitude. The k2 values for the entire series of substrates from Figures S4-S6 are listed in Tables S3-S4 in the SI (error bars are instead listed in Tables S3-S4).
