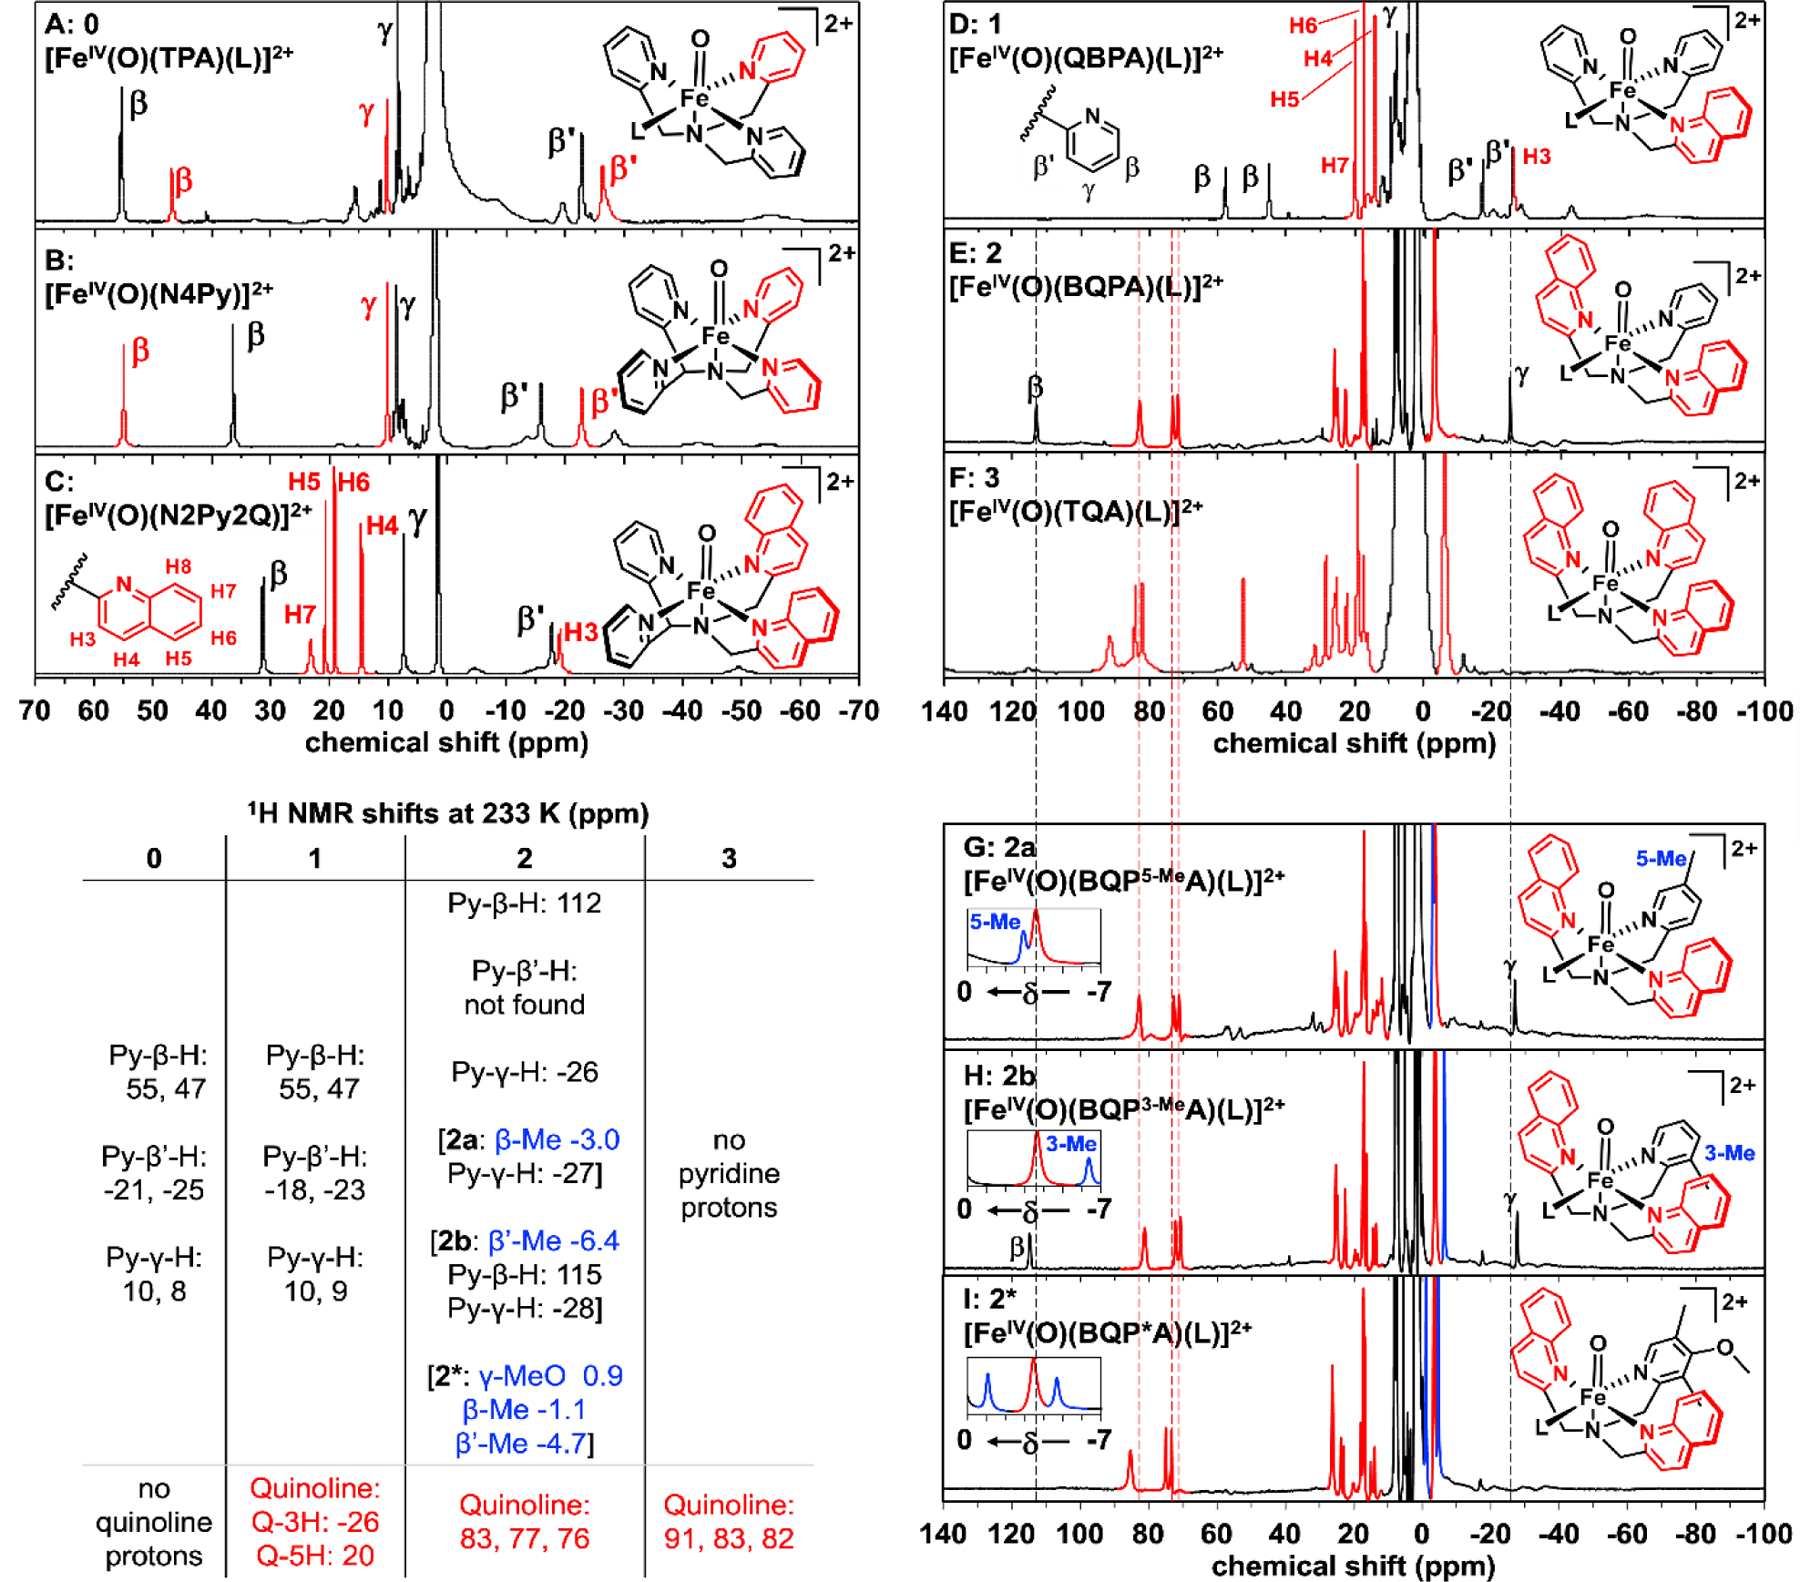
Figure 5.

1H-NMR spectra of [FeIV(O)(L)]2+ complexes obtained at 233 K in CD3CN: (A) S = 1 0;32 (B) S = 1 [FeIV(O)(N4Py)]2+;13 (C) S = 1 [FeIV(O)(N2Py2Q)]2+;30 (D) S = 1 1; (E) S = 2 2; (F) S = 2 3; (G) S = 2 2a (Py 5-Me substituted); (H) S = 2 2b (Py 3-Me-substituted); (I) S = 2 2* (Py 3,5-Me2-4-OMe-substituted). The insets in panels G, H, and I show the regions between 0 and -7 ppm with signals from methyl groups that replace β-H and β’-H protons in the two variants highlighted in blue. Quinoline-derived signals are highlighted in red, except in panels A and B. Their assignments in panels E - I are based on predictions from DFT calculations using the Borgogno protocol.15 Dashed lines from panel E through panel I show slightly larger quinoline paramagnetic shifts in 3 when compared with those in 2, 2a, 2b and 2*. No peaks were discerned beyond 140 ppm (Figure S18)
