Abstract
Serotype-specific differences in the capacity of reovirus strains to inhibit proliferation of murine L929 cells correlate with the capacity to induce apoptosis. The prototype serotype 3 reovirus strains Abney (T3A) and Dearing (T3D) inhibit cellular proliferation and induce apoptosis to a greater extent than the prototype serotype 1 reovirus strain Lang (T1L). We now show that reovirus-induced inhibition of cellular proliferation results from a G2/M cell cycle arrest. Using T1L × T3D reassortant viruses, we found that strain-specific differences in the capacity to induce G2/M arrest, like the differences in the capacity to induce apoptosis, are determined by the viral S1 gene. The S1 gene is bicistronic, encoding the viral attachment protein ς1 and the nonstructural protein ς1s. A ς1s-deficient reovirus strain, T3C84-MA, fails to induce G2/M arrest, yet retains the capacity to induce apoptosis, indicating that ς1s is required for reovirus-induced G2/M arrest. Expression of ς1s in C127 cells increases the percentage of cells in the G2/M phase of the cell cycle, supporting a role for this protein in reovirus-induced G2/M arrest. Inhibition of reovirus-induced apoptosis failed to prevent virus-induced G2/M arrest, indicating that G2/M arrest is not the result of apoptosis related DNA damage and suggests that these two processes occur through distinct pathways.
Reovirus infection of cultured cells results in inhibition of cellular proliferation (10, 17–19, 21, 24–27, 38, 40, 41, 44). Serotype 3 prototype strains type 3 Abney (T3A) and type 3 Dearing (T3D) inhibit cellular DNA synthesis to a greater extent than the serotype 1 prototype strain type 1 Lang (T1L) (40, 44). Studies using T1L × T3A and T1L × T3D reassortant viruses indicate that the S1 gene is the primary determinant of DNA synthesis inhibition (40, 44). Earlier studies suggested that reovirus-induced inhibition of cellular proliferation results from inhibition of the initiation of DNA synthesis, consistent with a G1-S transition block (10, 19, 26, 27, 38).
Reovirus infection also results in apoptosis (11, 36, 37, 44, 45). Reovirus strains T3A and T3D induce apoptosis to substantially greater extent than T1L (44, 45). A significant correlation exists between the capacities of both T1L × T3A (r = 0.937) and T1L × T3D (r = 0.772) reassortant viruses and reovirus field isolate strains (r = 0.851) to inhibit cellular proliferation and induce apoptosis (44). Like strain-specific differences in DNA synthesis inhibition, strain-specific differences in apoptosis induction also segregate with the S1 gene (36, 44, 45).
The viral S1 gene segment is bicistronic, encoding the viral attachment protein, ς1, and a non-virion-associated protein with no known function, ς1s, from overlapping reading frames (20, 30, 39). Using a ς1s-deficient virus strain, it was shown that ς1s is not required for reovirus growth in cell culture and is dispensable for the induction of apoptosis (37). These observations in conjunction with the genetic mapping studies suggest that ς1 is the primary determinant of strain-specific differences in apoptosis induction. The S1 gene product associated with reovirus-induced inhibition of cellular DNA synthesis has not been identified.
We conducted experiments to further investigate the relationship between reovirus-induced cellular DNA synthesis inhibition and apoptosis. We found that inhibition of cellular proliferation in response to reovirus infection is caused by an arrest in the G2/M phase of the cell cycle. Reovirus strains differ in the capacity to induce G2/M arrest, and we used reassortant viruses to demonstrate that these differences segregate with the S1 gene. A reovirus ς1s mutant fails to induce G2/M arrest but retains the capacity to induce apoptosis. Inducible expression of ς1s results in the accumulation of cells in G2/M phase. Inhibition of reovirus-induced apoptosis does not affect reovirus-induced G2/M arrest. These results indicate that the ς1s protein is required for reovirus-induced G2/M arrest and suggest that reovirus-induced inhibition of cellular proliferation and induction of apoptosis involve independent pathways.
MATERIALS AND METHODS
Cells and viruses.
Spinner-adapted mouse L929 cells (ATCC CCL1) were grown in Joklik's modified Eagle's minimal essential medium (JMEM) supplemented to contain 5% heat-inactivated fetal bovine serum (Gibco BRL, Gaithersburg, Md.) and 2 mM l-glutamine (Gibco). Human embryonic kidney (HEK293) cells (ATCC CRL1573), Madin-Darby canine kidney (MDCK) cells (ATCC CCL34), C127 cells (ATCC CRL1616), and HeLa cells (ATCC CCL2) were grown in Dulbecco's modified Eagle's medium (DMEM) supplemented to contain 10% heat-inactivated fetal bovine serum (HEK293, MDCK, and C127) or 10% non-heat-inactivated fetal bovine serum (HeLa), 2 mM l-glutamine, and 100 U of penicillin and 100 μg of streptomycin per ml (Gibco). IκB-ΔN2 cells are HEK293 cells expressing a strong dominant-negative IκB mutant lacking the phosphorylation sites that regulate signal-dependent activation of NF-κB (7).
Reovirus strains T1L, T3A, and T3D are laboratory stocks. T1L × T3D reassortant viruses were grown from stocks originally isolated by Kevin Coombs, Bernard Fields, and Max Nibert (4, 9). The reovirus field-isolate strain type 3 clone 84 (T3C84) was isolated from a human host, and T3C84-MA was isolated as previously described (6, 12). Viral strains were plaque purified and passaged two to three times in L929 cells to generate working stocks as previously described (43).
Isolation and characterization of T3C84-MA/ς1s+.
T3C84-MA/ς1s+ was isolated following serial passage of T3C84 in MEL cells as previously described (6). To isolate a sialic acid binding MEL cell-adapted variant derived from T3C84 that retains the capacity to express ς1s, virus isolates from a fifth-passage murine erythroleukemia (MEL) cell lysate stock were plaque purified twice on L929 cell monolayers. Plaques were amplified twice in L929 cell cultures and used to infect L929 cells (107) at a multiplicity of infection (MOI) of 10 PFU per cell. Cytoplasmic extracts were prepared 24 h following infection as previously described (8). Protein (100 μg) was electrophoresed in a 14% sodium dodecyl sulfate-polyacrylamide gel and transferred to a nitrocellulose membrane. An immunoblot for ς1s was performed as previously described (37). The S1 gene of a fifth-passage isolate that expresses ς1s, termed T3C84-MA/ς1s+, was sequenced as previously described (6). T3C84-MA/ς1s+ contains the mutation at nucleotide 616 that results in a tryptophan-to-arginine substitution at residue 202 of the ς1 protein, which is also present in the S1 gene of T3C84-MA and confers the capacity to bind sialic acid but does not contain the mutation that results in the introduction of a stop codon following amino acid six in the ς1s protein.
Cellular proliferation.
L929 cells were seeded in six-well plates (Costar, Cambridge, Mass.) at 105 cells per well in a volume of 2.5 ml in JMEM supplemented to contain nonessential amino acids, 5% fetal bovine serum, 2 mM l-glutamine, 100 U of penicillin per ml, and 100 μg of streptomycin per ml. After 24 h of incubation, when cells were 10 to 20% confluent, the medium was removed, and cells were infected with viral strains at an MOI of 100 PFU per cell in a volume of 100 μl at 37°C for 1 h. After viral infection, 2.5 ml of fresh medium was added to each well. At various times postinfection, cells were harvested, resuspended in 2 ml of phosphate-buffered saline (PBS), and counted using a hemacytometer. Cell viability was determined by trypan blue exclusion. Results are presented as the viable cell numbers per milliliter.
Flow cytometry.
L929, HEK293, MDCK, and HeLa cells were seeded in either 12-well plates (Costar) at 105 cells per well in a volume of 1 ml per well or 24-well plates (Costar) at 3.7 × 10⁴ cells per well in a volume of 0.5 ml per well and then infected with reovirus as described above. Cells were harvested, washed once with PBS, and stained at 4°C overnight with Krishan's stain containing 3.8 mM trisodium citrate (Sigma Chemical Co., St. Louis, Mo.), 70 μM propidium iodide (Sigma), 0.01% Nonidet P-40 (Sigma), and 0.01 mg of RNase A (Boehringer Mannheim Co., Indianapolis, Ind.) per ml (33). Cell cycle analysis was performed using a Coulter Epics XL flow cytometer (Beckman-Coulter, Hialeah, Fla.). Alignment of the instrument was verified daily using DNA check beads (Coulter). Peak versus integral gating was used to exclude doublet events from the analysis. Data were collected for 10,000 events. The Modfit LT program (Verity Software House, Topsham, Maine) was used for cell cycle modeling.
Cell synchronization.
L929 cells were seeded in 24-well plates at 3.7 × 10⁴ cells per well in a volume of 0.5 ml per well. After 24 h, cells were treated with 1 μM amethopterin (methotrexate) (Sigma) and 50 μM adenosine (Sigma) for 16 h. Cells were washed twice with PBS, infected with reovirus, and incubated with fresh JMEM supplemented to contain 5% heat-inactivated fetal bovine serum, 2 mM l-glutamine, and 2 mg of thymidine (Sigma) per ml. At various times after infection, cells were harvested, washed once with PBS, and stained at 4°C overnight with Krishan's stain as described above.
Quantitation of apoptosis by acridine orange staining.
L929, HEK293, MDCK, and HeLa cells were seeded and infected with reovirus as described above. The percentage of apoptotic cells was determined at 48 h postinfection as previously described (16, 45). Cells were harvested, washed once with PBS, resuspended in 25 μl of cell culture medium, and stained with 1 μl of a dye solution containing 100 μg of acridine orange (Sigma) per ml and 100 μg of ethidium bromide (Sigma) per ml. Cells were examined by epifluorescence microscopy (Nikon Labophot-2; B-2A filter; excitation, 450 to 490 nm; barrier, 520 nm; dichroic mirror, 505 nm) and scored as apoptotic if their nuclei contained uniformly stained condensed or fragmented chromatin (16, 45).
Apoptosis inhibitors.
L929 cells were seeded in 24-well plates at 3.7 × 10⁴ cells per well in a volume of 0.5 ml per well. After 24 h of incubation, cells were incubated with the calpain inhibitor PD150606 (Parke-Davis Pharmaceutical Research, Ann Arbor, Mich.) (50 μM, L929 cell), the caspase 3 inhibitor DEVD-CHO (Clontech, Palo Alto, Calif.) (100 μM, HEK293), or anti-TRAIL antibody (Affinity Bioreagents, Golden, Colo.) (30 μM, HEK293) for 1 h. Cells were then infected with T3A at an MOI of 100 PFU per cell at 37°C for 1 h. Following infection, media containing the apoptosis inhibitor was added. Cells were harvested and analyzed for either apoptosis or cell cycle arrest at 48 h postinfection.
Inducible expression of ς1s.
C127 stable transformants expressing T3D ς1s (BPX-6) from the mouse metallothionein promoter and vector control (BPV-12) were provided by Aaron Shatkin (21). BPX-6 and BPV-12 cells were seeded in 24-well plates at 3.0 × 10⁴ cells per well in a volume of 0.5 ml per well. After 24 h of incubation, cells were incubated with 1 μM CdCl2 to induce ς1s expression (22) and harvested at various times postinduction for cell cycle analysis.
RESULTS
Reovirus strains T1L and T3A differ in the capacity to inhibit cellular proliferation.
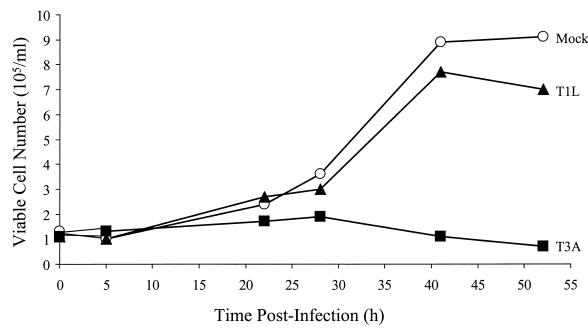
We have previously shown that T1 and T3 reovirus strains differ in the capacity to inhibit cellular DNA synthesis as measured by [3H]thymidine incorporation (40, 44). To determine whether reovirus-induced DNA synthesis inhibition is associated with inhibition of cellular proliferation, we infected L929 cells with either T1L or T3A at an MOI of 100 PFU per cell. At various intervals after infection, viable cells were counted (Fig. 1). Infection with T3A resulted in complete inhibition of cellular proliferation. A modest reduction in proliferation was observed for cells infected with T1L compared to mock-infected controls. Therefore, strain-specific differences in inhibition of cellular proliferation parallel those previously reported for DNA synthesis inhibition.
FIG. 1.
Reovirus inhibits cellular proliferation. Asynchronous, subconfluent monolayers of L929 cells were either mock infected (circles) or infected with T1L (triangles) or T3A (squares) at an MOI of 100 PFU per cell. Cells were harvested at the indicated times postinfection and counted. Cells that excluded trypan blue were scored as viable. Results are presented as the number of viable cells × 105 per ml. The results from a representative experiment of three independent experiments are shown.
T3 reoviruses induce G2/M arrest.
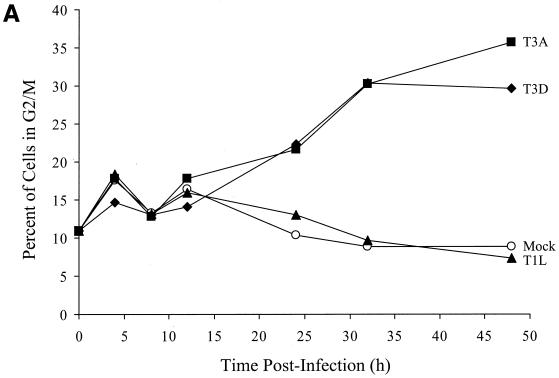
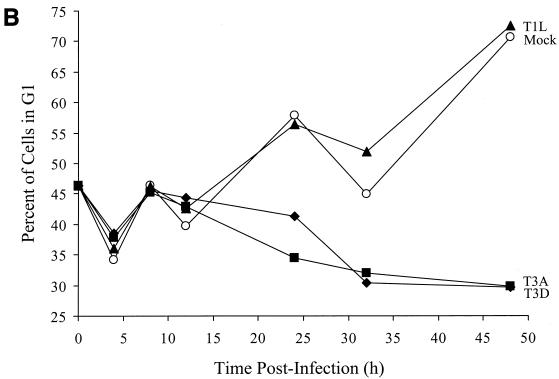
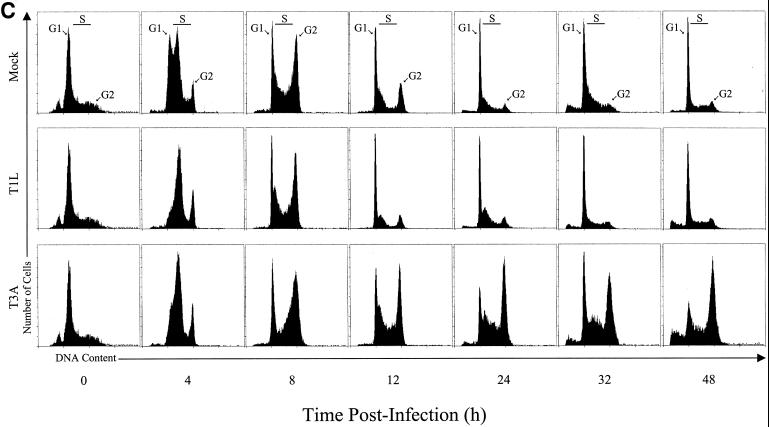
To identify the phase in the cell cycle that T3 reoviruses inhibit cellular proliferation, we analyzed reovirus-infected cells using flow cytometry. L929 cells were infected with T1L, T3A, or T3D at an MOI of 100 PFU per cell and stained with Krishan's stain (33) containing propidium iodide to determine cellular DNA content at various intervals postinfection. The results were converted to the percentage of cells in G2/M phase of the cell cycle using Modfit LT software (Fig. 2). Infection with either T3A or T3D resulted in a substantial increase in the percentage of cells in the G2/M phase of the cell cycle compared to T1L-infected or mock-infected cells by 24 h postinfection (Fig. 2A). There also was a corresponding decrease in the percentage of cells in G1 phase following infection with either T3A or T3D compared to T1L-infected or mock-infected cells (Fig. 2B). To confirm these results, L929 cells were synchronized with methotrexate prior to reovirus infection and assessed for cell cycle progression (Fig. 2C). Similar to findings with unsynchronized cells, T3A induced a significant increase in the proportion of cells in the G2/M phase of the cell cycle compared to T1L or mock infection. The increase in the proportion of cells in G2/M was first seen at 12 h postinfection and was maintained throughout the observation period (48 h). These findings indicate that the inhibition of proliferation induced by T3 reoviruses is caused by a block in the G2/M phase of the cell cycle. Following T1L or mock infection, cells traverse the cell cycle, proliferate, and reenter the cell cycle. Conversely, T3-infected cells enter the cell cycle, stall in G2/M phase, and do not proliferate.
FIG. 2.
T3 reovirus induces an increase in the percentage of cells in the G2/M phase of the cell cycle. Asynchronous, subconfluent monolayers of L929 cells were either mock infected (circles) or infected with T1L (triangles), T3A (squares), or T3D (diamonds) at an MOI of 100 PFU per cell. Cells were harvested at the indicated times postinfection, stained with Krishan's stain, and analyzed for DNA content using flow cytometry. Results are presented as the percentage of cells in G2/M phase (A) or G1 phase (B) of the cell cycle. Results of a representative experiment of three independent experiments are shown. (C) L929 cells were synchronized with 1 μM methotrexate and 50 μM adenosine for 16 h. Cells were released using fresh media containing 2 mg of thymidine per ml and either mock infected or infected with T1L or T3A at an MOI of 100 PFU per cell. Cells were harvested at the indicated times postinfection, stained with Krishan's stain, and analyzed for DNA content using flow cytometry. Results are presented as the cell cycle distribution following either mock, T1L, or T3A infection at the indicated times postinfection.
T3 reovirus-induced G2/M arrest is dose dependent.
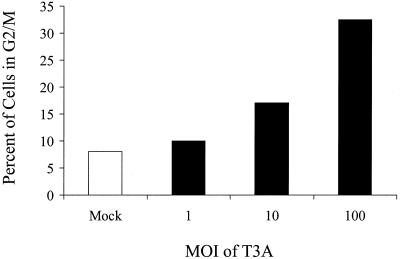
To investigate the relationship between MOI and the induction of G2/M arrest, we infected L929 cells with T3A at MOIs of 1, 10, and 100 PFU per cell. Cells were harvested at 48 h postinfection, stained with Krishan's stain (33), and analyzed for DNA content by flow cytometry (Fig. 3). T3A infection induced a greater percentage of cells in G2/M than mock infection at each MOI tested, and the effect was dose dependent.
FIG. 3.
G2/M arrest induced by T3 reovirus is dose dependent. Asynchronous, subconfluent monolayers of L929 cells were either mock infected or infected with T3A at MOIs of 1, 10, and 100 PFU per cell. Cells were harvested at 48 h postinfection, stained with Krishan's stain, and analyzed for DNA content using flow cytometry. Results are presented as the percentage of cells in G2/M phase.
G2/M arrest occurs in a variety of cell lines following T3 reovirus infection.
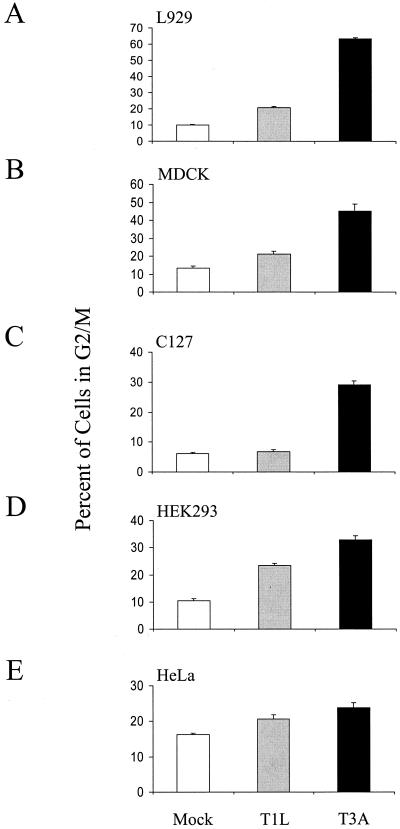
To determine whether the capacity of reovirus to block cell cycle progression is cell type dependent, L929, MDCK, C127, HEK293, and HeLa cells were either mock infected or infected with T1L or T3A at an MOI of 100 PFU per cell. Cells were harvested at 48 h postinfection, stained with Krishan's stain (33), and analyzed for DNA content by flow cytometry (Fig. 4). T3A infection induced a greater percentage of cells in G2/M than either T1L or mock infection in all cell lines tested. However, the magnitude of the strain-specific difference was greatest in L929 (Fig. 4A), MDCK (Fig. 4B), and C127 (Fig. 4C) cells. Therefore, reovirus-induced G2/M arrest is not cell type specific and likely requires non-cell-type-specific factors to mediate G2/M arrest.
FIG. 4.
T3 reovirus induces G2/M arrest in murine, canine, and human cells. Asynchronous, subconfluent monolayers of L929 (A), MDCK (B), C127 (C), HEK293 (D), and HeLa (E) cells were either mock infected (white) or infected with T1L (gray) or T3A (black) at an MOI of 100 PFU per cell. Cells were harvested at 48 h postinfection, stained with Krishan's stain, and analyzed for DNA content using flow cytometry. Results are presented as the mean percentage of cells in G2/M phase for three independent experiments. The error bars indicate the standard errors of the mean. A significantly greater percentage of T3A-infected cells were in G2/M than mock-infected cells in all cell lines tested (P < 0.01 to 0.001). A significantly greater percentage of T3A-infected cells were in G2/M than T1L-infected cells in all cell lines tested (P < 0.01 to 0.001) except HeLa. A significantly greater percentage of T1L-infected cells were in G2/M than mock-infected cells in L929 and HEK293 cells (P < 0.001).
T3 reovirus G2/M arrest phenotype is dominant.
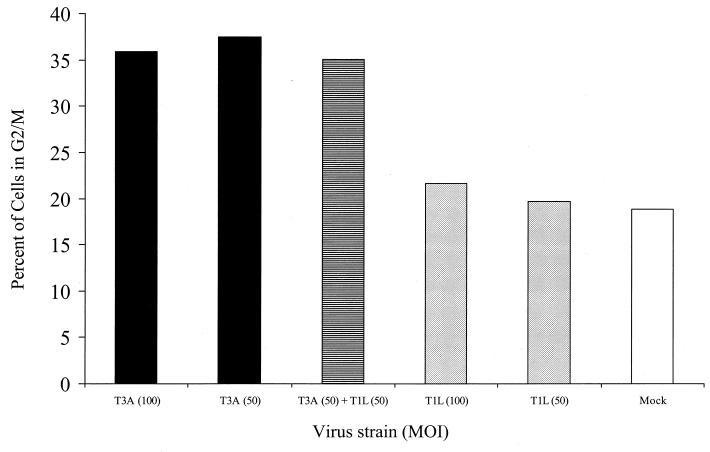
To determine whether G2/M arrest resulting from T3 reovirus infection could be overcome by T1 reovirus infection, we coinfected L929 cells with equivalent MOIs of T1L and T3A and measured the percentage of cells in G2/M by flow cytometry at 48 h postinfection. The percentage of cells in G2/M after coinfection with T1L and T3A was identical to that of T3A alone and significantly greater than that of T1L alone (Fig. 5). These results indicate that the G2/M arrest phenotype of T3 reovirus is dominant.
FIG. 5.
T3A-induced G2/M arrest phenotype is dominant. L929 cells were either mock infected (white), coinfected with equivalent MOIs of T1L and T3A (the MOI of each virus was 50 PFU per cell) (hatched), or infected with T1L (shaded) or T3A (solid) alone at MOIs of 50 or 100 PFU per cell. L929 cells were harvested at 48 h postinfection and analyzed using flow cytometry. The results are presented as the percentage of cells in the G2/M phase of the cell cycle.
G2/M arrest by T1L × T3D reassortant viruses.
To identify viral genes associated with differences in the capacity of T1L and T3D to induce G2/M arrest, we tested 12 T1L × T3D reassortant viruses for the capacity to induce G2/M arrest in unsynchronized and synchronized L929 cells (Table 1). The results demonstrate a significant association between the capacity of reassortant viruses to induce G2/M arrest in unsynchronized L929 cells and the S1 gene segment (Student t test, P = 0.004; Mann-Whitney, P = 0.007). No other viral genes were significantly associated with G2/M arrest in this analysis (t test and Mann-Whitney, all P > 0.05). However, when L929 cells were synchronized prior to infection, the results demonstrate a significant association between the capacity of reassortant viruses to induce G2/M arrest and the derivation of the S1 gene segment (Student t test, P = 0.007; Mann-Whitney, P = 0.016) and the M2 gene segment (Student t test, P = 0.007; Mann-Whitney, P = 0.016). We used parametric stepwise linear regression analysis to determine whether the S1 and M2 genes contributed independently to the capacity of T1L × T3D reassortant viruses to induce G2/M arrest. We obtained R2 values of 91.3 and 96.7% for the regression equation using all 10 reovirus genes for unsynchronized and synchronized L929 cells, respectively: 52.2% (P = 0.004) for S1 in unsynchronized L929 cells and 84.9% (P < 0.001) for S1 and M2 and 53.5% (P = 0.007) for the S1 gene alone in synchronized L929 cells. These results indicate that the S1 gene segment is the primary determinant of strain-specific differences in reovirus-induced G2/M arrest.
TABLE 1.
Capacities of T1L × T3D reassortant viruses to induce G2/M arrest
| Virus strain | Genome segmenta
|
% Cells in G2/Mb
|
||||||||||
|---|---|---|---|---|---|---|---|---|---|---|---|---|
| L1 | L2 | L3 | M1 | M2 | M3 | S1 | S2 | S3 | S4 | Unsynchronized | Synchronized | |
| EB138 | 3D | 1L | 1L | 3D | 3D | 1L | 3D | 3D | 1L | 1L | ND | 24.56 |
| EB28 | 3D | 3D | 1L | 3D | 3D | 3D | 3D | 1L | 3D | 3D | 38.13 | 28.59 |
| KC150 | 3D | 1L | 1L | 1L | 3D | 1L | 3D | 3D | 1L | 3D | 33.91 | 36.47 |
| EB97 | 3D | 3D | 1L | 3D | 3D | 3D | 3D | 3D | 3D | 1L | 30.30 | 28.35 |
| G2 | 1L | 3D | 1L | 1L | 1L | 1L | 3D | 1L | 1L | 1L | 29.09 | 13.92 |
| H41 | 3D | 3D | 1L | 1L | 1L | 3D | 1L | 1L | 3D | 1L | 26.56 | ND |
| T3D | 3D | 3D | 3D | 3D | 3D | 3D | 3D | 3D | 3D | 3D | 25.71 | 38.51 |
| H15 | 1L | 3D | 3D | 1L | 3D | 3D | 3D | 3D | 3D | 1L | 24.95 | 31.63 |
| EB127 | 3D | 3D | 1L | 1L | 3D | 1L | 1L | 3D | 3D | 1L | 23.54 | ND |
| H9 | 3D | 3D | 1L | 3D | 1L | 1L | 3D | 3D | 3D | 3D | 23.11 | 17.17 |
| EB85 | 1L | 1L | 1L | 1L | 1L | 3D | 1L | 3D | 1L | 1L | 21.88 | ND |
| T1L | 1L | 1L | 1L | 1L | 1L | 1L | 1L | 1L | 1L | 1L | 19.23 | 5.56 |
| EB145 | 3D | 3D | 3D | 3D | 3D | 1L | 1L | 3D | 3D | 3D | 15.72 | 14.72 |
| EB121 | 3D | 3D | 1L | 3D | 1L | 3D | 1L | 3D | 3D | 3D | 14.98 | 9.45 |
| EB1 | 1L | 3D | 1L | 1L | 3D | 1L | 1L | 1L | 3D | 1L | 11.89 | 16.19 |
| Significance (P)c | ||||||||||||
| Unsynchronized L cells | ||||||||||||
| t test | 0.30 | 0.84 | 0.60 | 0.85 | 0.46 | 0.36 | 0.004 | 0.78 | 0.58 | 0.66 | ||
| MW | 0.30 | 1 | 0.77 | 0.95 | 0.41 | 0.38 | 0.007 | 0.80 | 0.73 | 0.85 | ||
| Synchronized L cells | ||||||||||||
| t test | 0.25 | 1 | 0.27 | 0.73 | 0.007 | 0.16 | 0.007 | 0.18 | 0.67 | 0.53 | ||
| MW | 0.28 | 1 | 0.28 | 0.76 | 0.016 | 0.2 | 0.016 | 0.21 | 0.57 | 0.48 | ||
The parental origin of each genome segment in the reassortants strains: 1L, genome segment derived from T1L; 3D, genome segment derived from T3D.
Unsynchronized or synchronized L cells were infected with viral strains at an MOI of 100 PFU per cell and analyzed by flow cytometry at 48 h postinfection. ND, not determined.
As determined by two-sample parametric Student t test (t test) and Mann-Whitney nonparametric analysis (MW). Values in boldface are statistically significant.
G2/M arrest induced by T3 reovirus.
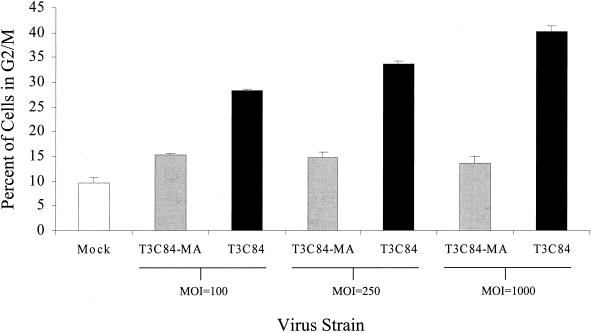
The S1 gene segment encodes two proteins, the viral attachment protein ς1 and the nonstructural protein ς1s (20, 30, 39). To determine whether ς1s is required for G2/M arrest, we infected L929 cells with reovirus strain T3C84-MA, which does not express ς1s (37) (Fig. 6). The percentage of cells in G2/M following infection with T3C84-MA was significantly less than the percentage of cells in G2/M following infection with the ς1s-expressing parental virus, T3C84. T3C84-MA failed to induce G2/M arrest, even at an MOI 10-fold greater than T3C84. T3C84-MA/ς1s+, a MEL-cell-adapted strain that does not contain the point mutation in S1 that results in an early stop codon in ς1s but contains the tryptophan-to-arginine substitution at position 202 in ς1, induced a level of G2/M arrest that was significantly greater than T3C84-MA at an MOI of 100 in L929 cells (P = 0.002; percentage of cells in G2/M following T3C84-MA/ς1s+ infection, 23.02 ± 1.1%). These findings indicate that functional ς1s is required for reovirus-induced G2/M arrest.
FIG. 6.
Reovirus-induced G2/M arrest requires ς1s. L929 cells were either mock infected (white) or infected with wild-type T3C84 (black) or ς1s-null mutant T3C84-MA (gray) at MOIs of 100, 250, or 1,000 PFU per cell. Cells were harvested 48 h postinfection, stained with Krishan's stain, and analyzed using flow cytometry. The results are presented as the mean percentage of cells in G2/M phase of the cell cycle for six independent experiments at an MOI of 100 and three independent experiments at MOIs of 250 and 1,000. The error bars indicate the standard errors of the mean. A significantly greater percentage of T3C84-infected cells were in G2/M than T3C84-MA-infected cells at each MOI tested (P < 0.001).
Expression of T3 ς1s induces an increase in the percentage of cells in G2/M phase.
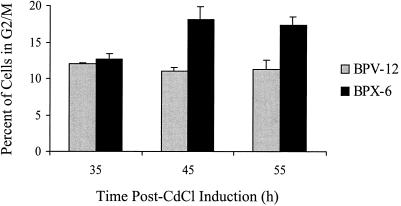
To determine whether ς1s alone is sufficient to induce the accumulation of cells in G2/M phase, we analyzed the DNA content of C127 cells engineered to express the T3D ς1s protein. Expression of ς1s from the mouse metallothionein promoter was induced by 1 μM CdCl2 (21) however, levels of ς1s were substantially less than levels found following natural virus infection (data not shown). The percentage of cells in G2/M following induction was significantly greater in cells expressing ς1s than in vector control cells at 45 and 55 h postinduction (P = 0.03 and P = 0.005, respectively) (Fig. 7). These results provide additional evidence that ς1s expression is involved in the accumulation of cells in the G2/M phase of the cell cycle.
FIG. 7.
ς1s expression induces an increase in the percentage of cells in G2/M phase. C127 cells stably transfected with ς1s (BPX-6) or vector control (BPV-12) under the control of the mouse metallothionein promoter were induced with CdCl2, harvested at the indicated times postinduction, and analyzed for DNA content by flow cytometry. The results are presented as the mean percentage of cells in the G2/M phase of the cell cycle for three to six independent experiments. The error bars indicate the standard errors of the mean. The percentage of cells in G2/M was significantly greater in the ς1s-expressing cells than in the vector-control cells at 45 h (P = 0.03, n = 4) and 55 h (P = 0.005, n = 6) postinduction.
Reovirus-induced apoptosis can be dissociated from reovirus-induced G2/M arrest.
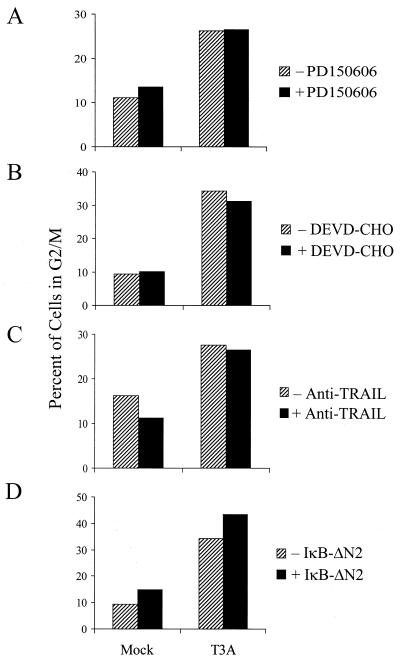
Previous studies indicate that the capacity of reovirus to inhibit DNA synthesis correlates with the capacity to induce apoptosis (44). Like strain-specific differences in reovirus-induced G2/M arrest, differences in the capacity of reovirus strains to inhibit DNA synthesis and induce apoptosis are determined by the S1 gene (40, 44). To determine whether apoptosis-associated disruption of cellular DNA is required for reovirus-induced inhibition of cellular proliferation, L929 cells or HEK293 cells were either mock infected or infected with T3A in the presence or absence of inhibitors of reovirus-induced apoptosis (7, 8, 11). Treatment of cells with the calpain inhibitor PD150606 (11), the caspase inhibitor DEVD-CHO (D. J. Kominsky, personal communication), or anti-TRAIL antibody (7) blocks reovirus-induced apoptosis, as does expression of an IκB mutant that blocks NF-κB activation (7, 8). G2/M arrest was evaluated by flow cytometry at 48 h postinfection (Fig. 8). Treatment with the calpain inhibitor PD150606 (Fig. 8A), the caspase 3 inhibitor DEVD-CHO (Fig. 8B), or anti-TRAIL antibody (Fig. 8C) using conditions that inhibit reovirus-induced apoptosis, had no effect on T3A-induced G2/M arrest, nor did inhibition of NF-κB by expression of a dominant-negative IκB (7, 8) (Fig. 8D). Therefore, inhibitors of reovirus-induced apoptosis do not inhibit reovirus-induced G2/M arrest. These findings indicate that apoptosis induced DNA damage is not required for reovirus-induced G2/M arrest.
FIG. 8.
Inhibitors of reovirus-induced apoptosis do not inhibit reovirus-induced G2/M arrest. (A) Effect of calpain inhibitor PD150606 on T3A-induced G2/M arrest. L929 cells were treated with either 25 μM calpain inhibitor PD150606 or an ethanol control and then either mock infected or infected with T3A at an MOI of 100 PFU per cell. (B) Effect of caspase 3 inhibitor DEVD-CHO on T3A-induced G2/M arrest. HEK293 cells were treated with either 100 μM caspase 3 inhibitor DEVD-CHO or a dimethyl sulfoxide control and then either mock infected or infected with T3A at an MOI of 100 PFU per cell. (C) Effect of anti-TRAIL antibodies on T3A-induced G2/M arrest. HEK293 cells were treated with either 30 μg of an anti-TRAIL antibody per ml or mock treated as a control and then either mock infected or infected with T3A at an MOI of 100 PFU per cell. (D) Effect of NF-κB inhibition on T3A-induced G2/M arrest. HEK293 cells expressing a dominant-negative form of IκB (IκB-ΔN2) to inhibit NF-κB activation or untransfected HEK293 cells were either mock infected or infected with T3A at an MOI of 100 PFU per cell. In all cases, G2/M arrest was assessed 48 h postinfection.
DISCUSSION
T3 reovirus strains inhibit host cell proliferation, as measured by cellular DNA synthesis inhibition, to a substantially greater extent than T1 reovirus strains (40, 44). It had been suggested, based on extrapolation of results obtained using [3H]thymidine incorporation, that T3 reoviruses induce cell cycle arrest at the G1-to-S transition. We now show, using flow cytometry to directly analyze cell cycle progression in reovirus-infected cells, that reovirus-induced inhibition of cellular proliferation results from G2/M arrest. This effect is not cell type specific and is dominant in strains that block cell cycle progression.
Differences in the capacity of reovirus strains to inhibit cellular proliferation are determined by the viral S1 gene (40, 44). Our results indicate that the same is true for G2/M arrest. The reovirus S1 gene is bicistronic, encoding the structural protein ς1 and the nonstructural protein ς1s using overlapping, alternative reading frames (20, 30, 39). As a result of this coding strategy, there is no sequence similarity between the ς1 and ς1s proteins (12). To determine which of the two S1-encoded proteins are required for G2/M arrest, we examined the capacity of the ς1s null mutant T3C84-MA to induce G2/M arrest. T3C84-MA and its ς1s expressing parent, T3C84, produce equivalent yields of viral progeny in L929 cells, and both viruses are equally effective in inducing apoptosis (37). However, T3C84-MA fails to induce G2/M arrest. This finding suggests that ς1s is required for blockade of cell cycle progression following T3 reovirus infection. It is also possible that differences in the capacity of T3C84 and T3C84-MA to induce cell cycle arrest are influenced by other sequence differences. The mutation in the S1 gene that introduces a termination codon in the ς1s open reading frame also results in a lysine-to-isoleucine substitution at residue 26 in the deduced amino acid sequence of ς1. The T3C84-MA S1 gene also contains an additional mutation that results in a tryptophan-to-arginine substitution at residue 202 in ς1, which determines the capacity of this strain to bind sialic acid. To exclude the possibility that sialic acid binding influences cell cycle arrest, we isolated and characterized an additional T3C84-MA variant, T3C84-MA/ς1s+, that binds to sialic acid and expresses ς1s. In contrast to T3C84-MA, which binds sialic acid but does not express ς1s, T3C84-MA/ς1s+ induces G2/M arrest. Therefore, it is unlikely that the capacity to bind sialic acid influences the efficiency of cell cycle arrest induced by T3 reoviruses.
To corroborate findings made using viruses that vary in ς1s expression, we also tested the capacity of cells engineered to express ς1s under the control of an inducible promoter to undergo cell cycle arrest. Following induction of ς1s expression, we observed an increase in the percentage of cells in the G2/M phase of the cell cycle, which suggests that ς1s is capable of mediating cell cycle blockade at the G2/M checkpoint. This observation suggests that the reovirus ς1s protein is similar to the human immunodeficiency virus (HIV) Vpr protein (2, 28, 31, 35) or the human papillomavirus (HPV) E2 protein (23), which similarly block cell cycle progression at the G2/M boundary. Thus, our findings indicate that reovirus-induced G2/M arrest requires ς1s and provide the first evidence of a functional role for this nonstructural protein.
We have previously shown that the capacity of reovirus to induce apoptosis correlates with the capacity to inhibit cellular proliferation and that both properties are determined by the viral S1 gene (44). Our results clearly show that G2/M arrest can occur in cells treated with potent inhibitors of reovirus-induced apoptosis. These findings indicate that the induction of G2/M arrest and apoptosis by reovirus are functionally independent at some stage following infection. Moreover, although strain-specific differences in reovirus-induced G2/M arrest and apoptosis induction segregate with the viral S1 gene, each property is determined by a different S1 gene product. Strain-specific differences in reovirus-induced G2/M arrest are determined by ς1s, whereas differences in reovirus-induced apoptosis are determined by ς1 (36, 45). The induction of G2/M arrest by HIV Vpr is apparently required for Vpr-induced apoptosis (42), whereas reovirus-induced apoptosis can occur in the absence of G2/M arrest (37). These findings suggest that viruses may utilize different mechanisms to induce G2/M arrest and apoptosis.
The G2/M transition is regulated by the kinase cdc2/cdk1 (13–15, 32, 34). Expression of HIV Vpr (28, 35) or HPV E2 protein (23) results in inhibition or delayed activation of cdc2 kinase activity resulting in an accumulation of cells in the G2/M phase of the cell cycle. In contrast, the baculovirus Autographa californica nuclear polyhydrosis virus (AcNPV) (3) and herpes simplex virus (HSV) (1, 29) induce G2/M arrest by a mechanism that is cdc2 independent, since cells infected with either of these viruses maintain high levels of cdc2 kinase activity. HIV, HPV, AcNPV, and HSV require a nuclear phase to replicate, whereas reovirus replicates in the cytoplasm. T3 ς1s has been detected in the nucleus as well as in the cytoplasm following reovirus infection (5, 37), and it is possible that this nuclear localization is required for reovirus-induced G2/M arrest. Future studies will be aimed at identifying which cell cycle regulatory proteins are involved in reovirus-induced cell cycle perturbation, the role of cellular localization of ς1s in this process, and the significance of cell cycle arrest in reovirus-induced cytopathology and pathogenesis.
ACKNOWLEDGMENTS
This work was supported by Public Health Service grant 1RO1AG14071 from the National Institute of Aging, Merit and REAP grants from the Department of Veterans Affairs, and a U.S. Army Medical Research and Material Command grant (USAMRMC 98293015) (K.L.T.). This work also was supported by Public Health Service grant AI38296 from the National Institute of Allergy and Infectious Diseases and the Elizabeth B. Lamb Center for Pediatric Research (T.S.D.).
The University of Colorado Cancer Center provided core flow cytometry facilities.
REFERENCES
- 1.Advani S J, Brandimarti R, Weichselbaum R R, Roizman B. The disappearance of cyclins A and B and the increase in activity of the G(2)/M-phase cellular kinase cdc2 in herpes simplex virus 1-infected cells require expression of the alpha22/U(S)1.5 and U(L)13 viral genes. J Virol. 2000;74:8–15. [PMC free article] [PubMed] [Google Scholar]
- 2.Bartz S R, Rogel M E, Emerman M. Human immunodeficiency virus type 1 cell cycle control: Vpr is cytostatic and mediates G2 accumulation by a mechanism which differs from DNA damage checkpoint control. J Virol. 1996;70:2324–2331. doi: 10.1128/jvi.70.4.2324-2331.1996. [DOI] [PMC free article] [PubMed] [Google Scholar]
- 3.Braunagel S C, Parr R, Belyavskyi M, Summers M D. Autographa californica nucleopolyhedrovirus infection results in Sf9 cell cycle arrest at G2/M phase. Virology. 1998;244:195–211. doi: 10.1006/viro.1998.9097. [DOI] [PubMed] [Google Scholar]
- 4.Brown E G, Nibert M L, Fields B N. The L2 gene of reovirus serotype 3 controls the capacity to interfere, accumulate deletions and establish persistent infection. In: Compans R W, Bishop D H L, editors. Double-stranded RNA viruses. New York, N.Y: Elsevier; 1983. pp. 275–287. [Google Scholar]
- 5.Ceruzzi M, Shatkin A J. Expression of reovirus p14 in bacteria and identification in the cytoplasm of infected mouse L cells. Virology. 1986;153:35–45. doi: 10.1016/0042-6822(86)90005-x. [DOI] [PubMed] [Google Scholar]
- 6.Chappell J D, Gunn V L, Wetzel J D, Baer G S, Dermody T S. Mutations in type 3 reovirus that determine binding to sialic acid are contained in the fibrous tail domain of viral attachment protein sigma1. J Virol. 1997;71:1834–1841. doi: 10.1128/jvi.71.3.1834-1841.1997. [DOI] [PMC free article] [PubMed] [Google Scholar]
- 7.Clarke P, Meintzer S M, Spencer G, Widmann C, Garrington T P, Johnson G L, Tyler K L. Reovirus-induced apoptosis is mediated by TRAIL. J Virol. 2000;74:8135–8139. doi: 10.1128/jvi.74.17.8135-8139.2000. [DOI] [PMC free article] [PubMed] [Google Scholar]
- 8.Connolly J L, Rodgers S E, Clarke P, Ballard D W, Kerr L D, Tyler K L, Dermody T S. Reovirus-induced apoptosis requires activation of transcription factor NF-κB. J Virol. 2000;74:2981–2989. doi: 10.1128/jvi.74.7.2981-2989.2000. [DOI] [PMC free article] [PubMed] [Google Scholar]
- 9.Coombs K M, Fields B N, Harrison S C. Crystallization of the reovirus type 3 Dearing core. Crystal packing is determined by the lambda 2 protein. J Mol Biol. 1990;215:1–5. doi: 10.1016/s0022-2836(05)80089-0. [DOI] [PubMed] [Google Scholar]
- 10.Cox D C, Shaw J E. Inhibition of the initiation of cellular DNA synthesis after reovirus infection. J Virol. 1974;13:760–761. doi: 10.1128/jvi.13.3.760-761.1974. [DOI] [PMC free article] [PubMed] [Google Scholar]
- 11.Debiasi R L, Squier M K, Pike B, Wynes M, Dermody T S, Cohen J J, Tyler K L. Reovirus-induced apoptosis is preceded by increased cellular calpain activity and is blocked by calpain inhibitors. J Virol. 1999;73:695–701. doi: 10.1128/jvi.73.1.695-701.1999. [DOI] [PMC free article] [PubMed] [Google Scholar]
- 12.Dermody T S, Nibert M L, Bassel-Duby R, Fields B N. Sequence diversity in S1 genes and S1 translation products of 11 serotype 3 reovirus strains. J Virol. 1990;64:4842–4850. doi: 10.1128/jvi.64.10.4842-4850.1990. [DOI] [PMC free article] [PubMed] [Google Scholar]
- 13.Draetta G, Beach D. Activation of cdc2 protein kinase during mitosis in human cells: cell cycle-dependent phosphorylation and subunit rearrangement. Cell. 1988;54:17–26. doi: 10.1016/0092-8674(88)90175-4. [DOI] [PubMed] [Google Scholar]
- 14.Draetta G, Eckstein J. Cdc25 protein phosphatases in cell proliferation. Biochim Biophys Acta. 1997;1332:M53–M63. doi: 10.1016/s0304-419x(96)00049-2. [DOI] [PubMed] [Google Scholar]
- 15.Draetta G, Piwnica-Worms H, Morrison D, Druker B, Roberts T, Beach D. Human cdc2 protein kinase is a major cell-cycle regulated tyrosine kinase substrate. Nature. 1988;336:738–744. doi: 10.1038/336738a0. [DOI] [PubMed] [Google Scholar]
- 16.Duke R C, Cohen J J. Morphological and biochemical assays of apoptosis. In: Coligan J E, editor. Current protocols in immunology. New York, N.Y: Wiley; 1992. pp. 3.17.1–3.17.16. [Google Scholar]
- 17.Duncan M R, Stanish S M, Cox D C. Differential sensitivity of normal and transformed human cells to reovirus infection. J Virol. 1978;28:444–449. doi: 10.1128/jvi.28.2.444-449.1978. [DOI] [PMC free article] [PubMed] [Google Scholar]
- 18.Ensminger W D, Tamm I. Cellular DNA and protein synthesis in reovirus-infected L cells. Virology. 1969;39:357–360. doi: 10.1016/0042-6822(69)90062-2. [DOI] [PubMed] [Google Scholar]
- 19.Ensminger W D, Tamm I. The step in cellular DNA synthesis blocked by reovirus infection. Virology. 1969;39:935–938. doi: 10.1016/0042-6822(69)90032-4. [DOI] [PubMed] [Google Scholar]
- 20.Ernst H, Shatkin A J. Reovirus hemagglutinin mRNA codes for two polypeptides in overlapping reading frames. Proc Natl Acad Sci USA. 1985;82:48–52. doi: 10.1073/pnas.82.1.48. [DOI] [PMC free article] [PubMed] [Google Scholar]
- 21.Fajardo E, Shatkin A J. Expression of the two reovirus S1 gene products in transfected mammalian cells. Virology. 1990;178:223–231. doi: 10.1016/0042-6822(90)90397-a. [DOI] [PubMed] [Google Scholar]
- 22.Fajardo J E, Shatkin A J. Translation of bicistronic viral mRNA in transfected cells: regulation at the level of elongation. Proc Natl Acad Sci USA. 1990;87:328–332. doi: 10.1073/pnas.87.1.328. [DOI] [PMC free article] [PubMed] [Google Scholar]
- 23.Fournier N, Raj K, Saudan P, Utzig S, Sahli R, Simanis V, Beard P. Expression of human papillomavirus 16 E2 protein in Schizosaccharomyces pombe delays the initiation of mitosis. Oncogene. 1999;18:4015–4021. doi: 10.1038/sj.onc.1202775. [DOI] [PubMed] [Google Scholar]
- 24.Gaulton G N, Greene M I. Inhibition of cellular DNA synthesis by reovirus occurs through a receptor-linked signaling pathway that is mimicked by antiidiotypic, antireceptor antibody. J Exp Med. 1989;169:197–211. doi: 10.1084/jem.169.1.197. [DOI] [PMC free article] [PubMed] [Google Scholar]
- 25.Gomatos P, Tamm I. Macromolecular synthesis in reovirus-infected L cells. Biochim Biophys Acta. 1963;72:651–653. [PubMed] [Google Scholar]
- 26.Hand R, Ensminger W D, Tamm I. Cellular DNA replication in infections with cytocidal RNA viruses. Virology. 1971;44:527–536. doi: 10.1016/0042-6822(71)90366-7. [DOI] [PubMed] [Google Scholar]
- 27.Hand R, Tamm I. Initiation of DNA replication in mammalian cells and its inhibition by reovirus infection. J Mol Biol. 1974;82:175–183. doi: 10.1016/0022-2836(74)90339-8. [DOI] [PubMed] [Google Scholar]
- 28.He J, Choe S, Walker R, Di Marzio P, Morgan D O, Landau N R. Human immunodeficiency virus type 1 viral protein R (Vpr) arrests cells in the G2 phase of the cell cycle by inhibiting p34cdc2 activity. J Virol. 1995;69:6705–6711. doi: 10.1128/jvi.69.11.6705-6711.1995. [DOI] [PMC free article] [PubMed] [Google Scholar]
- 29.Hobbs W E, DeLuca N A. Perturbation of cell cycle progression and cellular gene expression as a function of herpes simplex virus ICP0. J Virol. 1999;73:8245–8255. doi: 10.1128/jvi.73.10.8245-8255.1999. [DOI] [PMC free article] [PubMed] [Google Scholar]
- 30.Jacobs B L, Samuel C E. Biosynthesis of reovirus-specified polypeptides: the reovirus s1 mRNA encodes two primary translation products. Virology. 1985;143:63–74. doi: 10.1016/0042-6822(85)90097-2. [DOI] [PubMed] [Google Scholar]
- 31.Jowett J B, Planelles V, Poon B, Shah N P, Chen M L, Chen I S. The human immunodeficiency virus type 1 vpr gene arrests infected T cells in the G2 + M phase of the cell cycle. J Virol. 1995;69:6304–6313. doi: 10.1128/jvi.69.10.6304-6313.1995. [DOI] [PMC free article] [PubMed] [Google Scholar]
- 32.King R W, Jackson P K, Kirschner M W. Mitosis in transition. Cell. 1994;79:563–571. doi: 10.1016/0092-8674(94)90542-8. [DOI] [PubMed] [Google Scholar]
- 33.Krishan A. Rapid flow cytofluorometric analysis of mammalian cell cycle by propidium iodide staining. J Cell Biol. 1975;66:188–193. doi: 10.1083/jcb.66.1.188. [DOI] [PMC free article] [PubMed] [Google Scholar]
- 34.Morla A O, Draetta G, Beach D, Wang J Y. Reversible tyrosine phosphorylation of cdc2: dephosphorylation accompanies activation during entry into mitosis. Cell. 1989;58:193–203. doi: 10.1016/0092-8674(89)90415-7. [DOI] [PubMed] [Google Scholar]
- 35.Re F, Braaten D, Franke E K, Luban J. Human immunodeficiency virus type 1 Vpr arrests the cell cycle in G2 by inhibiting the activation of p34cdc2-cyclin B. J Virol. 1995;69:6859–6864. doi: 10.1128/jvi.69.11.6859-6864.1995. [DOI] [PMC free article] [PubMed] [Google Scholar]
- 36.Rodgers S E, Barton E S, Oberhaus S M, Pike B, Gibson C A, Tyler K L, Dermody T S. Reovirus-induced apoptosis of MDCK cells is not linked to viral yield and is blocked by Bcl-2. J Virol. 1997;71:2540–2546. doi: 10.1128/jvi.71.3.2540-2546.1997. [DOI] [PMC free article] [PubMed] [Google Scholar]
- 37.Rodgers S E, Connolly J L, Chappell J D, Dermody T S. Reovirus growth in cell culture does not require the full complement of viral proteins: identification of a ς1s-null mutant. J Virol. 1998;72:8597–8604. doi: 10.1128/jvi.72.11.8597-8604.1998. [DOI] [PMC free article] [PubMed] [Google Scholar]
- 38.Roner M R, Cox D C. Cellular integrity is required for inhibition of initiation of cellular DNA synthesis by reovirus type 3. J Virol. 1985;53:350–359. doi: 10.1128/jvi.53.2.350-359.1985. [DOI] [PMC free article] [PubMed] [Google Scholar]
- 39.Sarkar G, Pelletier J, Bassel-Duby R, Jayasuriya A, Fields B N, Sonenberg N. Identification of a new polypeptide coded by reovirus gene S1. J Virol. 1985;54:720–725. doi: 10.1128/jvi.54.3.720-725.1985. [DOI] [PMC free article] [PubMed] [Google Scholar]
- 40.Sharpe A H, Fields B N. Reovirus inhibition of cellular DNA synthesis: role of the S1 gene. J Virol. 1981;38:389–392. doi: 10.1128/jvi.38.1.389-392.1981. [DOI] [PMC free article] [PubMed] [Google Scholar]
- 41.Shaw J E, Cox D C. Early inhibition of cellular DNA synthesis by high multiplicities of infectious and UV-inactivated reovirus. J Virol. 1973;12:704–710. doi: 10.1128/jvi.12.4.704-710.1973. [DOI] [PMC free article] [PubMed] [Google Scholar]
- 42.Stewart S A, Poon B, Jowett J B, Chen I S. Human immunodeficiency virus type 1 Vpr induces apoptosis following cell cycle arrest. J Virol. 1997;71:5579–5592. doi: 10.1128/jvi.71.7.5579-5592.1997. [DOI] [PMC free article] [PubMed] [Google Scholar]
- 43.Tyler K L, Bronson R T, Byers K B, Fields B. Molecular basis of viral neurotropism: experimental reovirus infection. Neurology. 1985;35:88–92. doi: 10.1212/wnl.35.1.88. [DOI] [PubMed] [Google Scholar]
- 44.Tyler K L, Squier M K, Brown A L, Pike B, Willis D, Oberhaus S M, Dermody T S, Cohen J J. Linkage between reovirus-induced apoptosis and inhibition of cellular DNA synthesis: role of the S1 and M2 genes. J Virol. 1996;70:7984–7991. doi: 10.1128/jvi.70.11.7984-7991.1996. [DOI] [PMC free article] [PubMed] [Google Scholar]
- 45.Tyler K L, Squier M K, Rodgers S E, Schneider B E, Oberhaus S M, Grdina T A, Cohen J J, Dermody T S. Differences in the capacity of reovirus strains to induce apoptosis are determined by the viral attachment protein sigma 1. J Virol. 1995;69:6972–6979. doi: 10.1128/jvi.69.11.6972-6979.1995. [DOI] [PMC free article] [PubMed] [Google Scholar]


