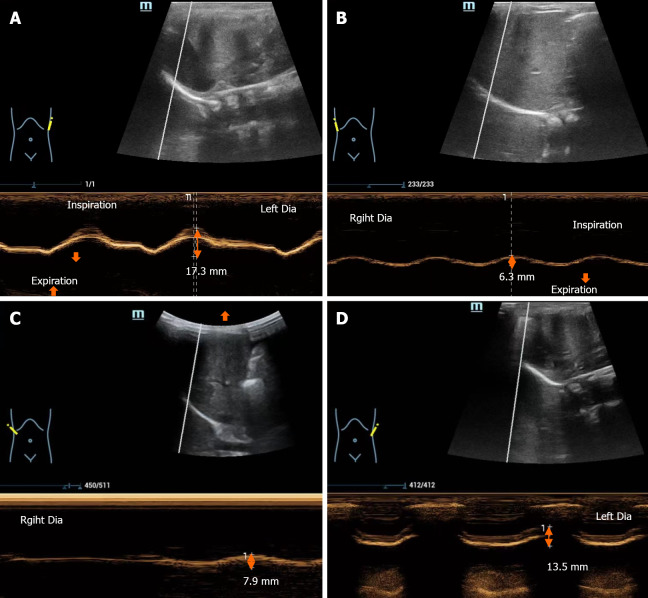
Figure 2.
Image changes in M-mode ultrasonography. A: The right diaphragm shows decreased motion with respiration; B: The left diaphragm shows normal excursion with phases of respiration; C: After 4 weeks, the decreased motion of the right diaphragm shows improvement; D: After 4 weeks, the left diaphragm shows normal motion during respiration. The arrows indicate the movement of the diaphragm.

