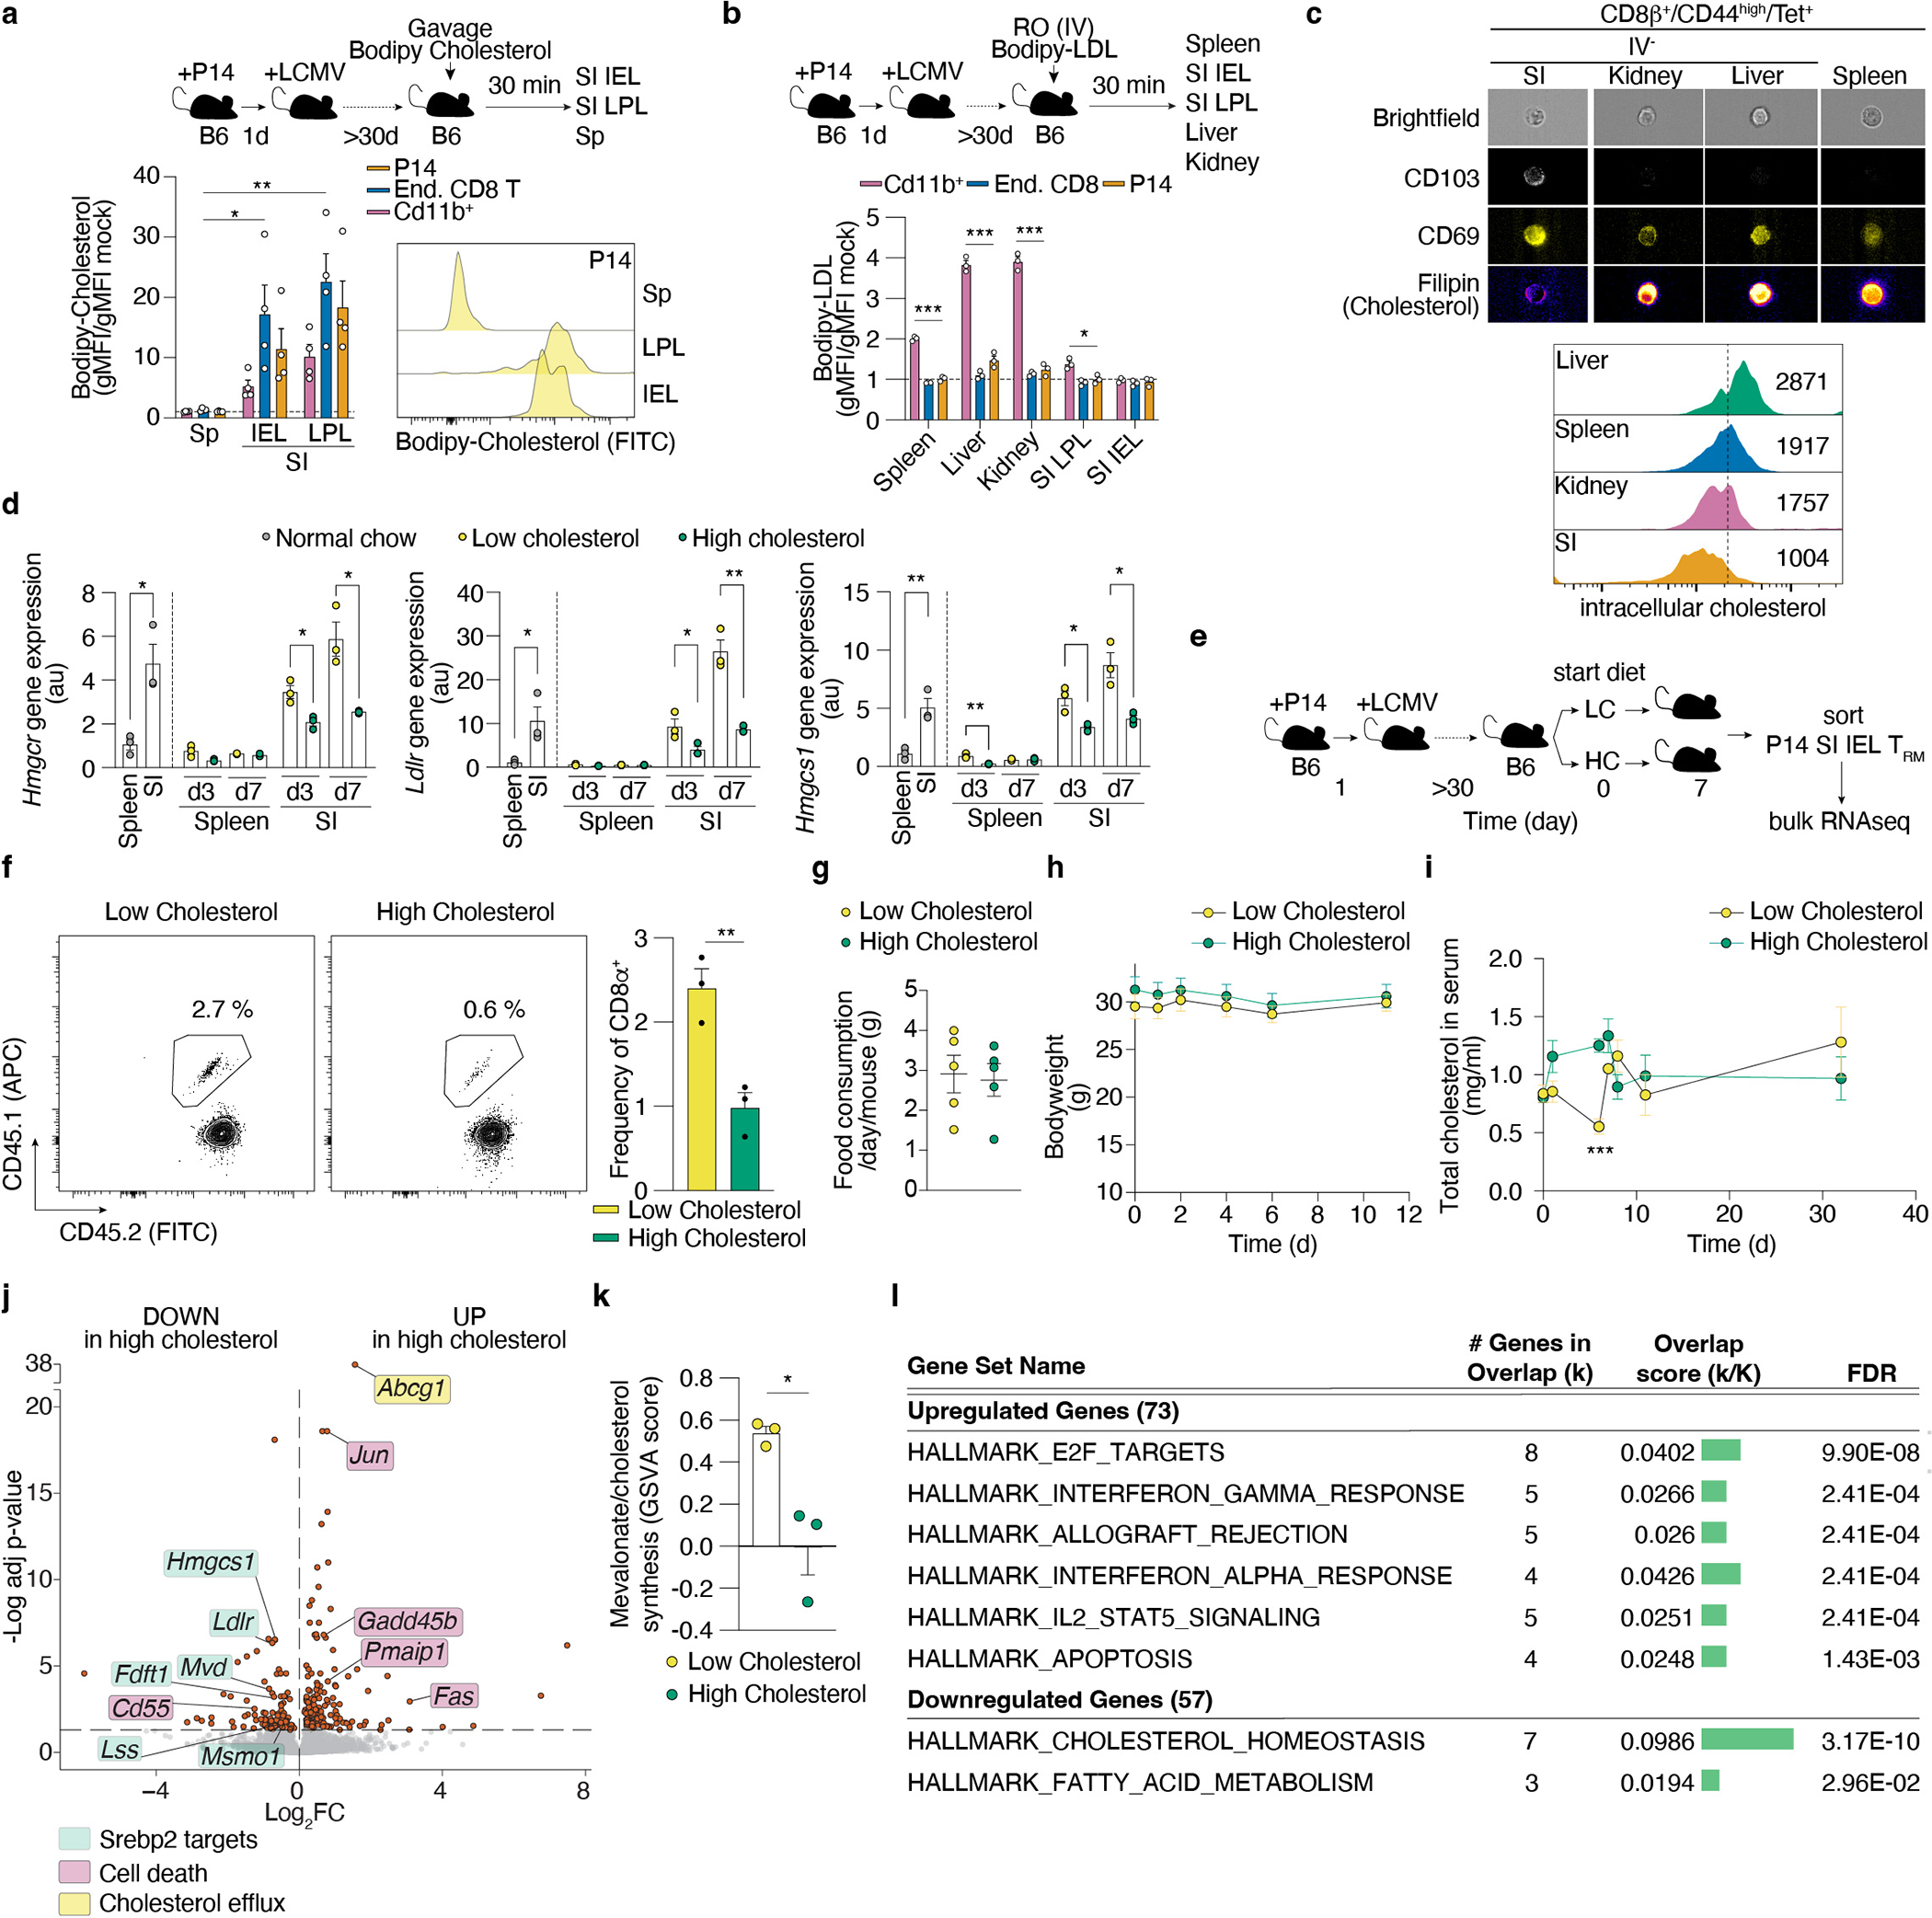
Extended Data Figure 5. SI TRM uptake and sense dietary cholesterol.

a, Quantification by flow cytometry of in vivo incorporation of Bodipy-cholesterol on indicated cell populations after 10 minutes after oral administration of Bodipy-cholesterol to memory P14 mice. b, Quantification by flow cytometry of incorporation of Bodipy-LDL on indicated cell types of the spleen 20 minutes (min) after IV delivery to memory P14 mice. c, Quantification of intracellular cholesterol by filipin staining in Tet+ populations of CD8 T cells for various tissues >30 days post LCMV infection measured by imaging flow cytometry. d, Gene expression analysis by qPCR of selected Srebp2 targets on CD8 T cells from the spleen and SI of mice on regular chow or subjected to low and high cholesterol-containing diets. e, Experimental design to measure transcriptional changes induced by dietary cholesterol on established SI TRM by ULI-RNAseq, f, SI TRM frequencies from total CD8 T cells after 7 days of dietary intervention. g, Food consumption per day per mouse subjected to a low or high-cholesterol diet. h, Bodyweight of mice subjected to low or high cholesterol-containing diets. i, Total cholesterol in serum in mice subjected to low or high cholesterol-containing diets. j, Volcano plot of differentially expressed genes in SI TRM from mice fed a high vs a low cholesterol-containing diet. k, Mevalonate/cholesterol synthesis GSVA scores in SI TRM from mice fed a high versus low cholesterol-containing diet. l, Gene pathway analysis of top upregulated and top downregulated genes between SI TRM from mice fed a high versus low cholesterol-containing diet (MsigDb, Hallmark gene sets). P14 CD8 T cells and CD8β+/CD44high/Tet+ from the kidney, liver and SI were gated on the IV− population (a, b, c, e, f, j, k, and l). Data are mean +/− s.e.m. and representative of at least two independent experiments, with a total of n=4 (a), n=3 (b, d), n=5 (c), n=3 (f) mice, or pooled from at least two independent experiments with a total of n=5–10 (g-i) mice, or performed once (j-l) with a total of n=3 samples each sample is 1×10³ SI TRM pooled from 2~3 mice (j, k). Two-sided unpaired t-Test (a, b, d, f, i, and k), and Deseq2 DEG testing with Benjamini-Hochberg multiple test correction (j). *P<0.05, **P<0.01, ***P< 0.005.
