
Extended Data Figure 7. Increased production of non-steroidal products of the mevalonate/cholesterol synthesis pathway is a common requirement between SI TRM and TIL.
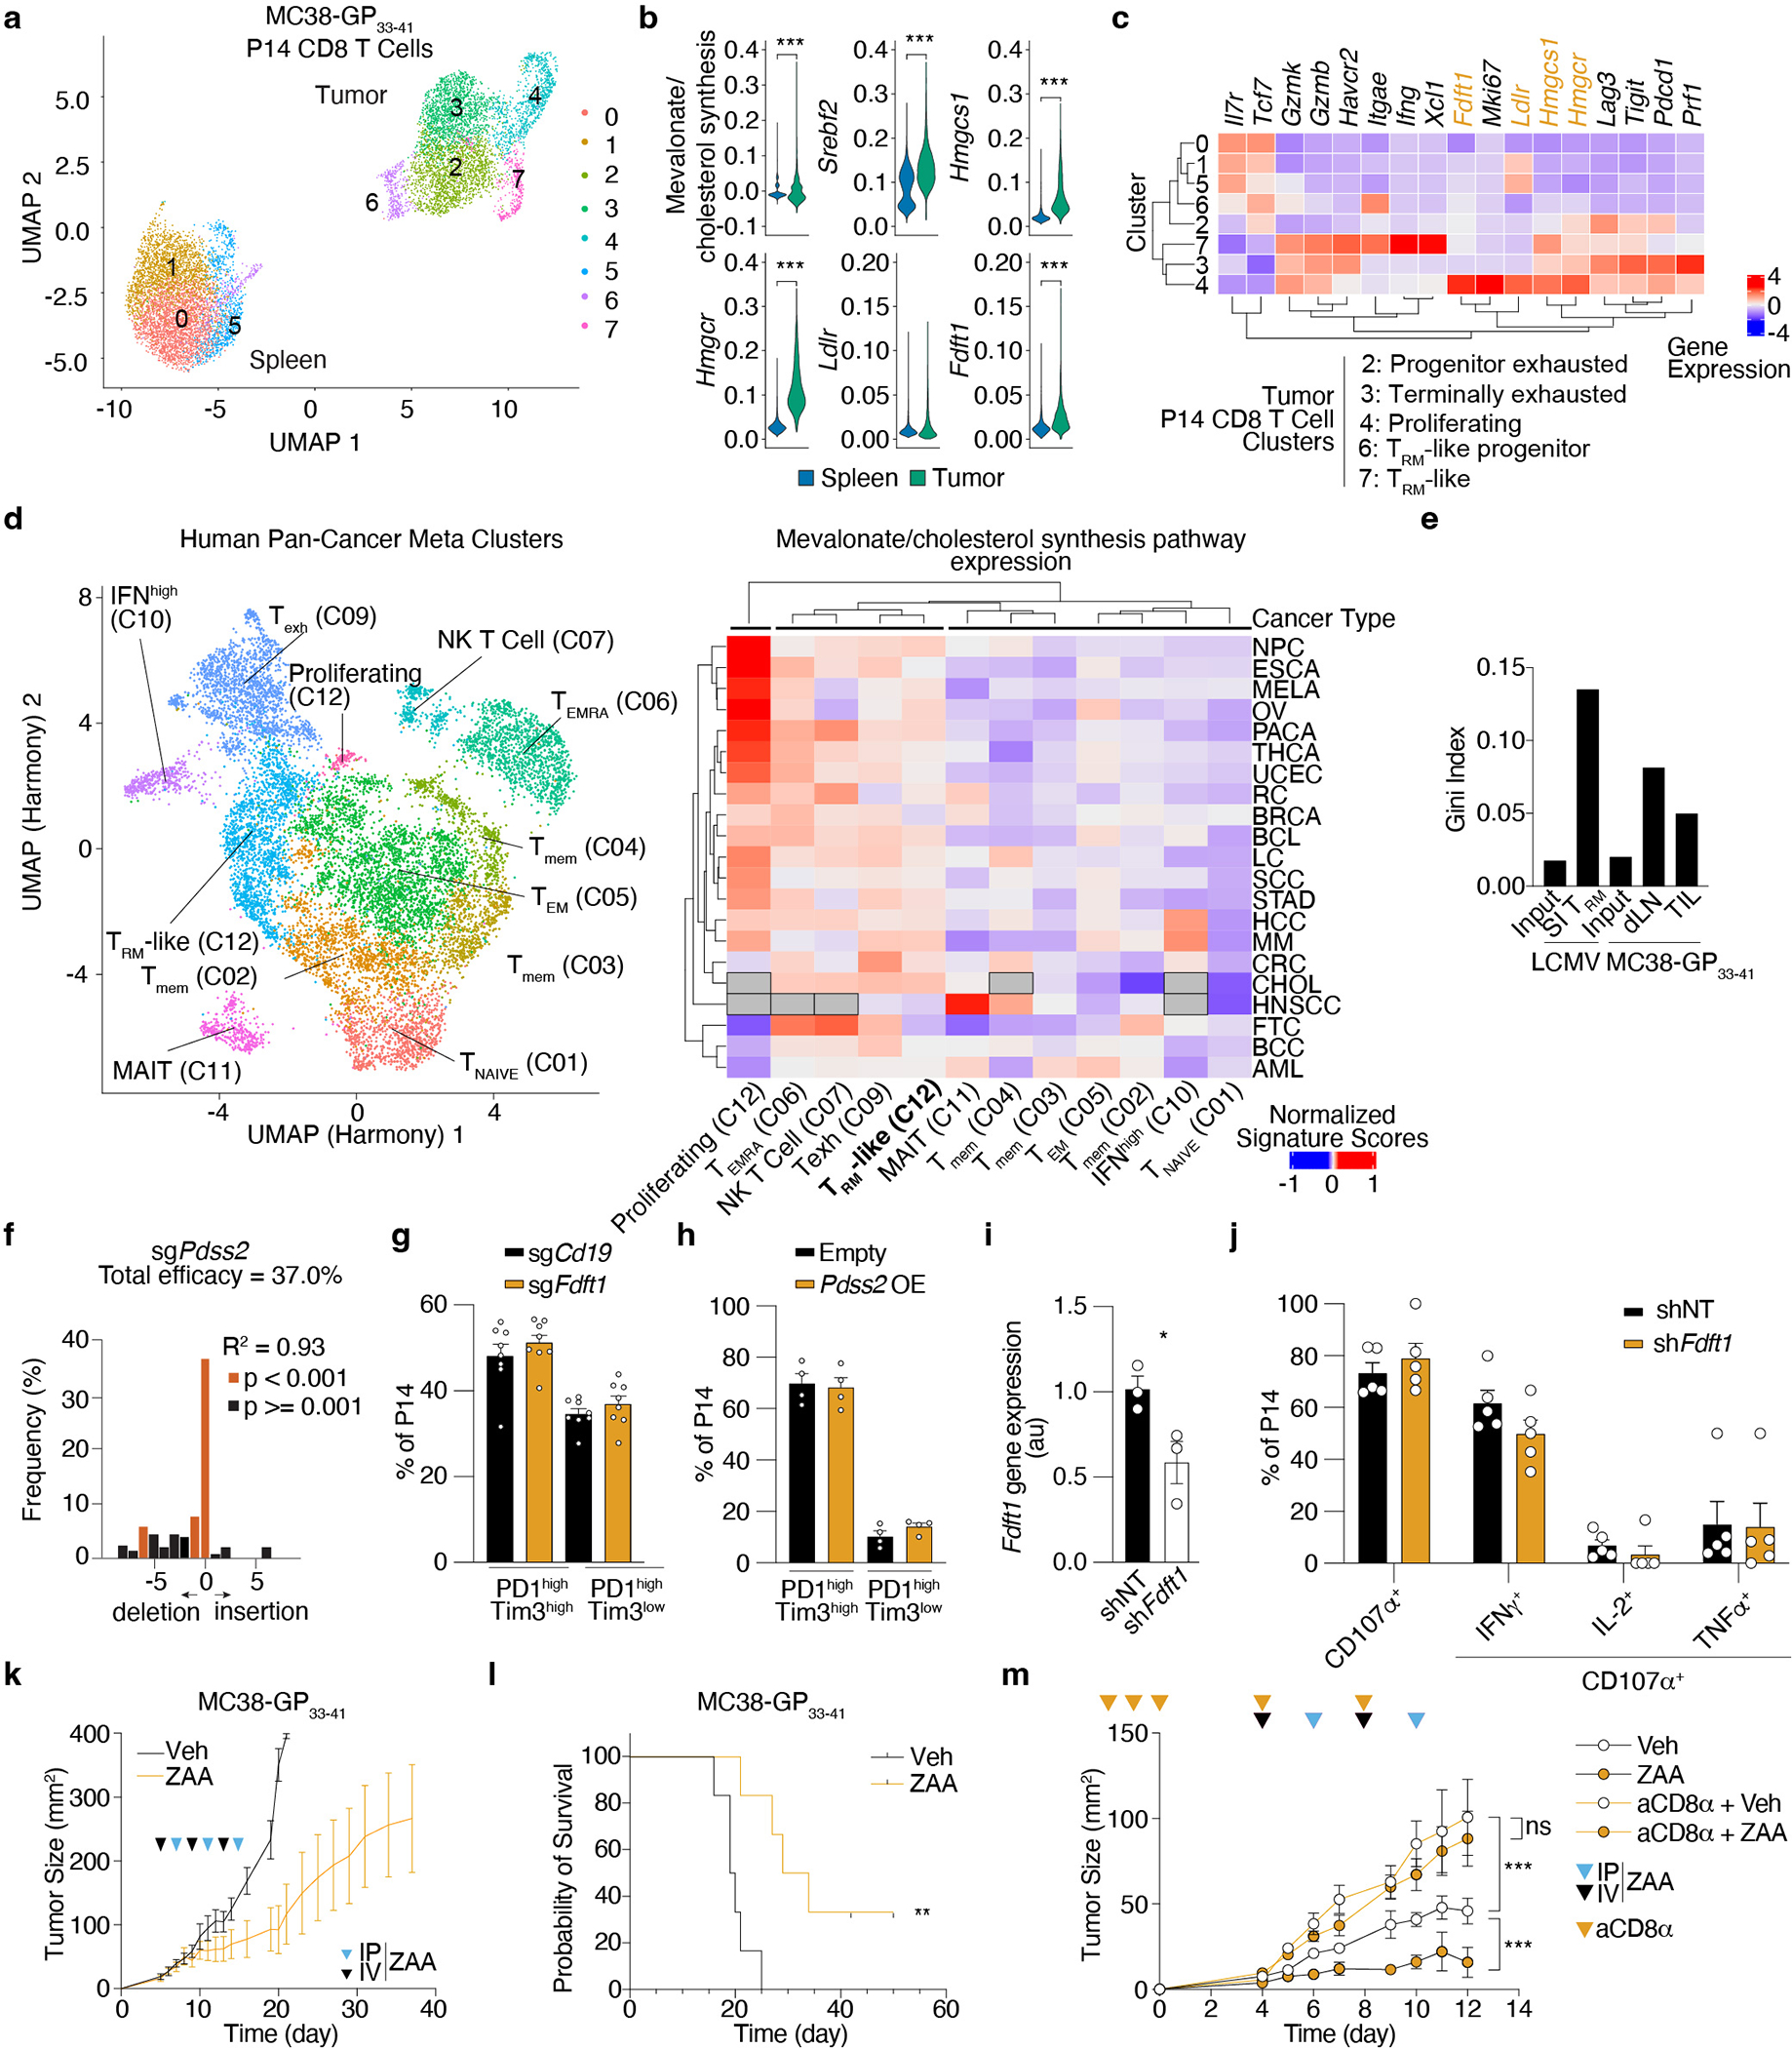
a, Dimensionality reduction plot by UMAP of P14 CD8 T cells profiled from spleens and subcutaneously implanted MC38-GP33–41 tumors by scRNAseq 7 days after ACT. b, Mevalonate/cholesterol synthesis signature values and expression of indicated genes in P14 CD8 T cells from the spleen and MC38-GP33–41 tumors profiled by scRNAseq. MAGIC-imputed gene values are shown. c, Hierarchically clustered heatmap of scaled averaged gene expression values by cluster of P14 cells profiled from spleens and MC38-GP33–41 tumors by scRNAseq 7 days after adoptive transfer. d, Dimensionality reduction plot by UMAP of CD8 T cell metaclusters (left) with “meta.cluster.coarse” labels and hierarchically clustered heatmap of mevalonate/cholesterol synthesis pathway scores grouped by “meta.cluster.coarse” labels and cell type. NPC, nasopharingeal carcinoma, ESCA, esophageal cancer, LC, lung cancer, HCC, hepatocellular carcinoma, CHOL, cholangiocarcinoma, RC, renal carcinoma, CRC, colorectal cancer, AML, acute myeloid leukemia, BCL, B-cell lymphoma, MM, multiple myeloma, HNSCC, head and neck squamous cell carcinoma, THCA, thyroid carcinoma, MELA, melanoma, BCC, basal cell carcinoma, SCC, squamous cell carcinoma, BRCA, breast cancer, STAD, stomach adenocarcinoma, PACA, pancreatic cancer, OV, ovarian cancer, FTC, fallopian tube carcinoma, UCEC, uterine corpus endometrial carcinoma. EMRA, effector memory CD45RA+, mem, memory. e, sgRNA library heterogeneity reported as Gini Index values. f, CRISPR/Cas9-mediated indel efficiency of the Pdss2 sgRNA construct on sorted transduced P14 CD8 T cells. g, Frequency of PD1highTim3high and PD1highTim3low subpopulations for sgCd19 and sgFdft1 Cas9 P14 CD8 T cells in MC38-GP33–41 tumors at day 5–7 after adoptive transfer. h, Frequency of PD1highTim3high and PD1highTim3low subpopulations for Empty and Pdss2 OE P14 CD8 T cells in MC38-GP33–41 tumors at day 5–7 after adoptive transfer. i, Quantification of gene expression by qPCR of control (shNT) and Fdft1 deficient (shFdft1) P14 CD8 T cells before adoptive transfer. j, Restimulation capacity of control (shNT) and Fdft1 deficient (shFdft1) P14 TIL 4 days after in vivo transfer treated with GP33–41 peptide ex vivo. k, MC38-GP33–41 tumor growth curves of mice receiving ZAA or vehicle. l, Survival of mice implanted with MC38-GP33–41 tumors receiving ZAA or vehicle. m, MC38-GP33–41 tumor growth curves of mice receiving ZAA in combination with CD8 T cell depletion. Data are mean +/− s.e.m.. (g, h, i, j, k, and m), raw values (d), geometrical distributions of single-cell gene expression values (b) or averaged gene expression (c and e) and pooled or representative of at least two independent experiments, with a total of n=2 (f) cell replicates, and n=8 (g), n=9 (h), n=3 (i), n=10 (j), n=12/group (k, l), n=5/group (m) mice. Two-sided unpaired t-Test (b, f and i). Log-rank test (l). Two-way ANOVA (m). *P<0.05, **P<0.01, ***P< 0.005.