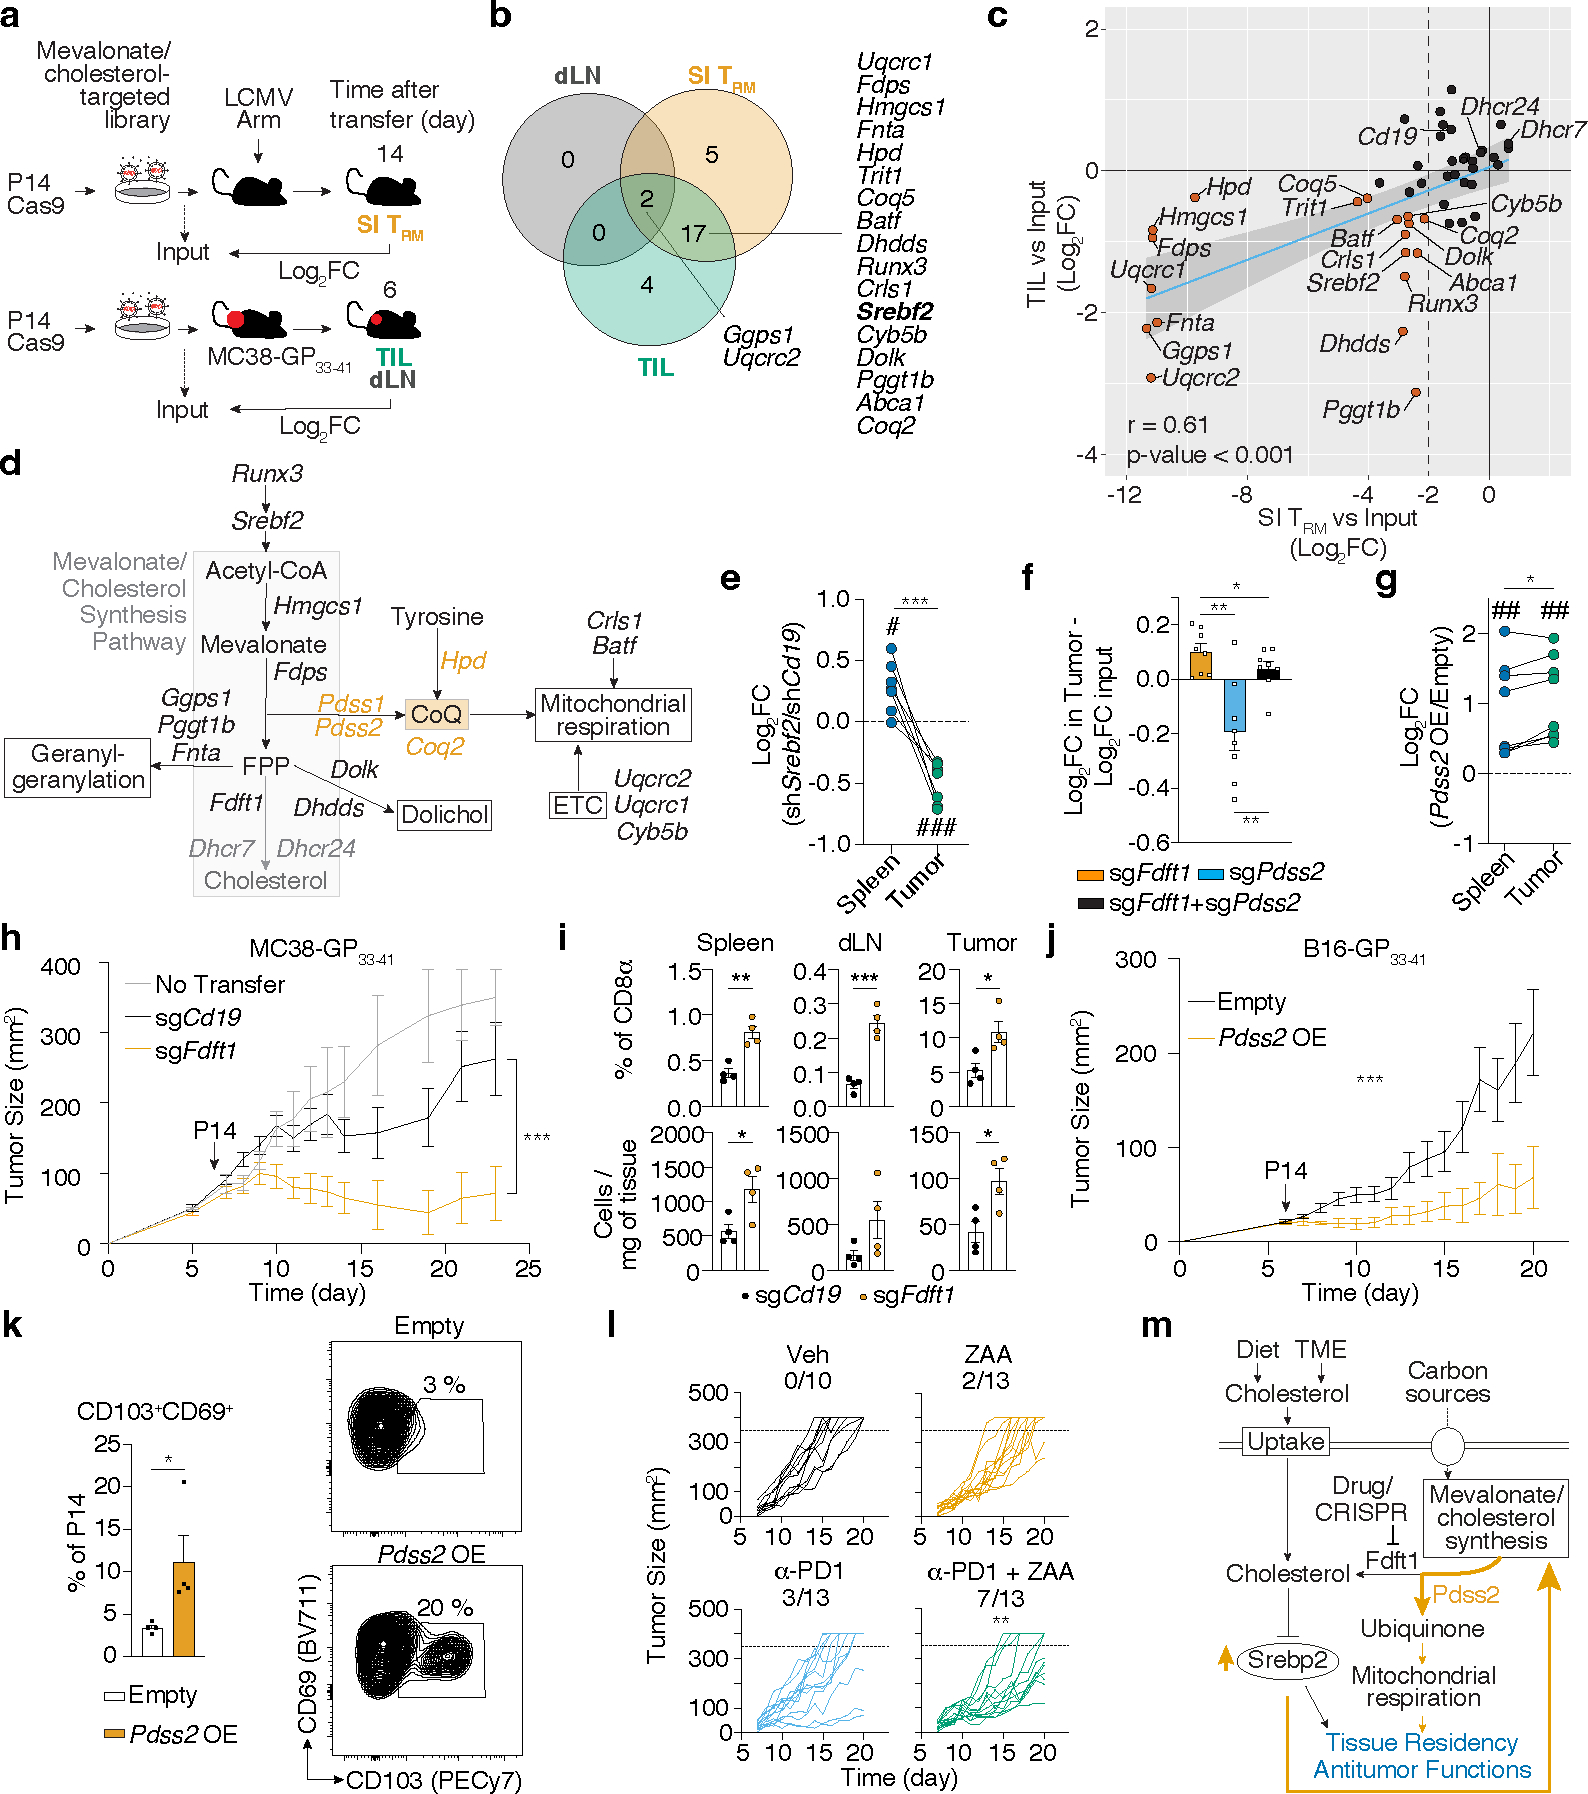
Figure 5. Increased production of non-steroidal products of the mevalonate/cholesterol synthesis pathway is a common requirement for SI TRM and TIL.

a, Targeted in vivo screen of mevalonate/cholesterol synthesis pathway genes for SI TRM formation in LCMV infection, and CD8 T cell accumulation in dLN and MC38-GP33–41 tumors. b, Venn diagram of significant genes (fdr < 0.01; dLN and TIL, fdr < 0.01 and Log2FC < −2, SI TRM) from (a). c, Log2FC of sgRNA frequencies for each screen from a. d, Metabolic pathway with relevant genes from a. e-g, Ratio of indicated transduced P14 CD8 T cells (e,g) or P14 Cas9eGFP CD8 T cells (f) in indicated tissues 5–7 days after adoptive cell transfer (ACT). h, MC38-GP33–41 tumor growth curves of mice receiving indicated transduced P14 Cas9eGFP CD8 T cells. i, Cell frequencies and total numbers of transduced P14 Cas9eGFP CD8 T cells in MC38-GP33–41 tumors, dLN, and spleens 4 days after ACT. j, B16-GP33–41 tumor growth curves in mice adoptively transferred with indicated transduced P14 CD8 T cells. k, Cell frequencies in Empty and Pdss2 OE P14 CD8 T cells in MC38-GP33–41 tumors. l, B16-GP33–41 tumor growth curves of mice receiving indicated treatments. m, Proposed model of the Srebp2-dependent metabolic programming of SI TRM and TIL. Data are mean +/− s.e.m. and representative or pooled from of at least two independent experiments (e-l), with a total of n=4 (SI TRM) and n=5 (tumor) (a-c), n=9 (e), n=8 (f), n=8 (g), n=3 (no transfer), n=15 (sgCd19), and n=16 (sgFdft1) (h), n=8 (i), n=9 (sgCd19) and n=7 (sgPdss2) (j), n=13 (k), n=10 (veh) and n=13 (rest) (l) mice, and one experiment (a-c), with n=3–5 mice pooled in each sample (a-c). Two-sided unpaired (f and i) and paired (e, g, and k) t-Test. Two-way ANOVA (h and j). Pearson correlation (r) (c). Fisher’s exact test (l). *P<0.05, **P<0.01, ***P< 0.005. Two-sided one-sample t-Test (e and g) #P<0.05, ###P<0.005.
