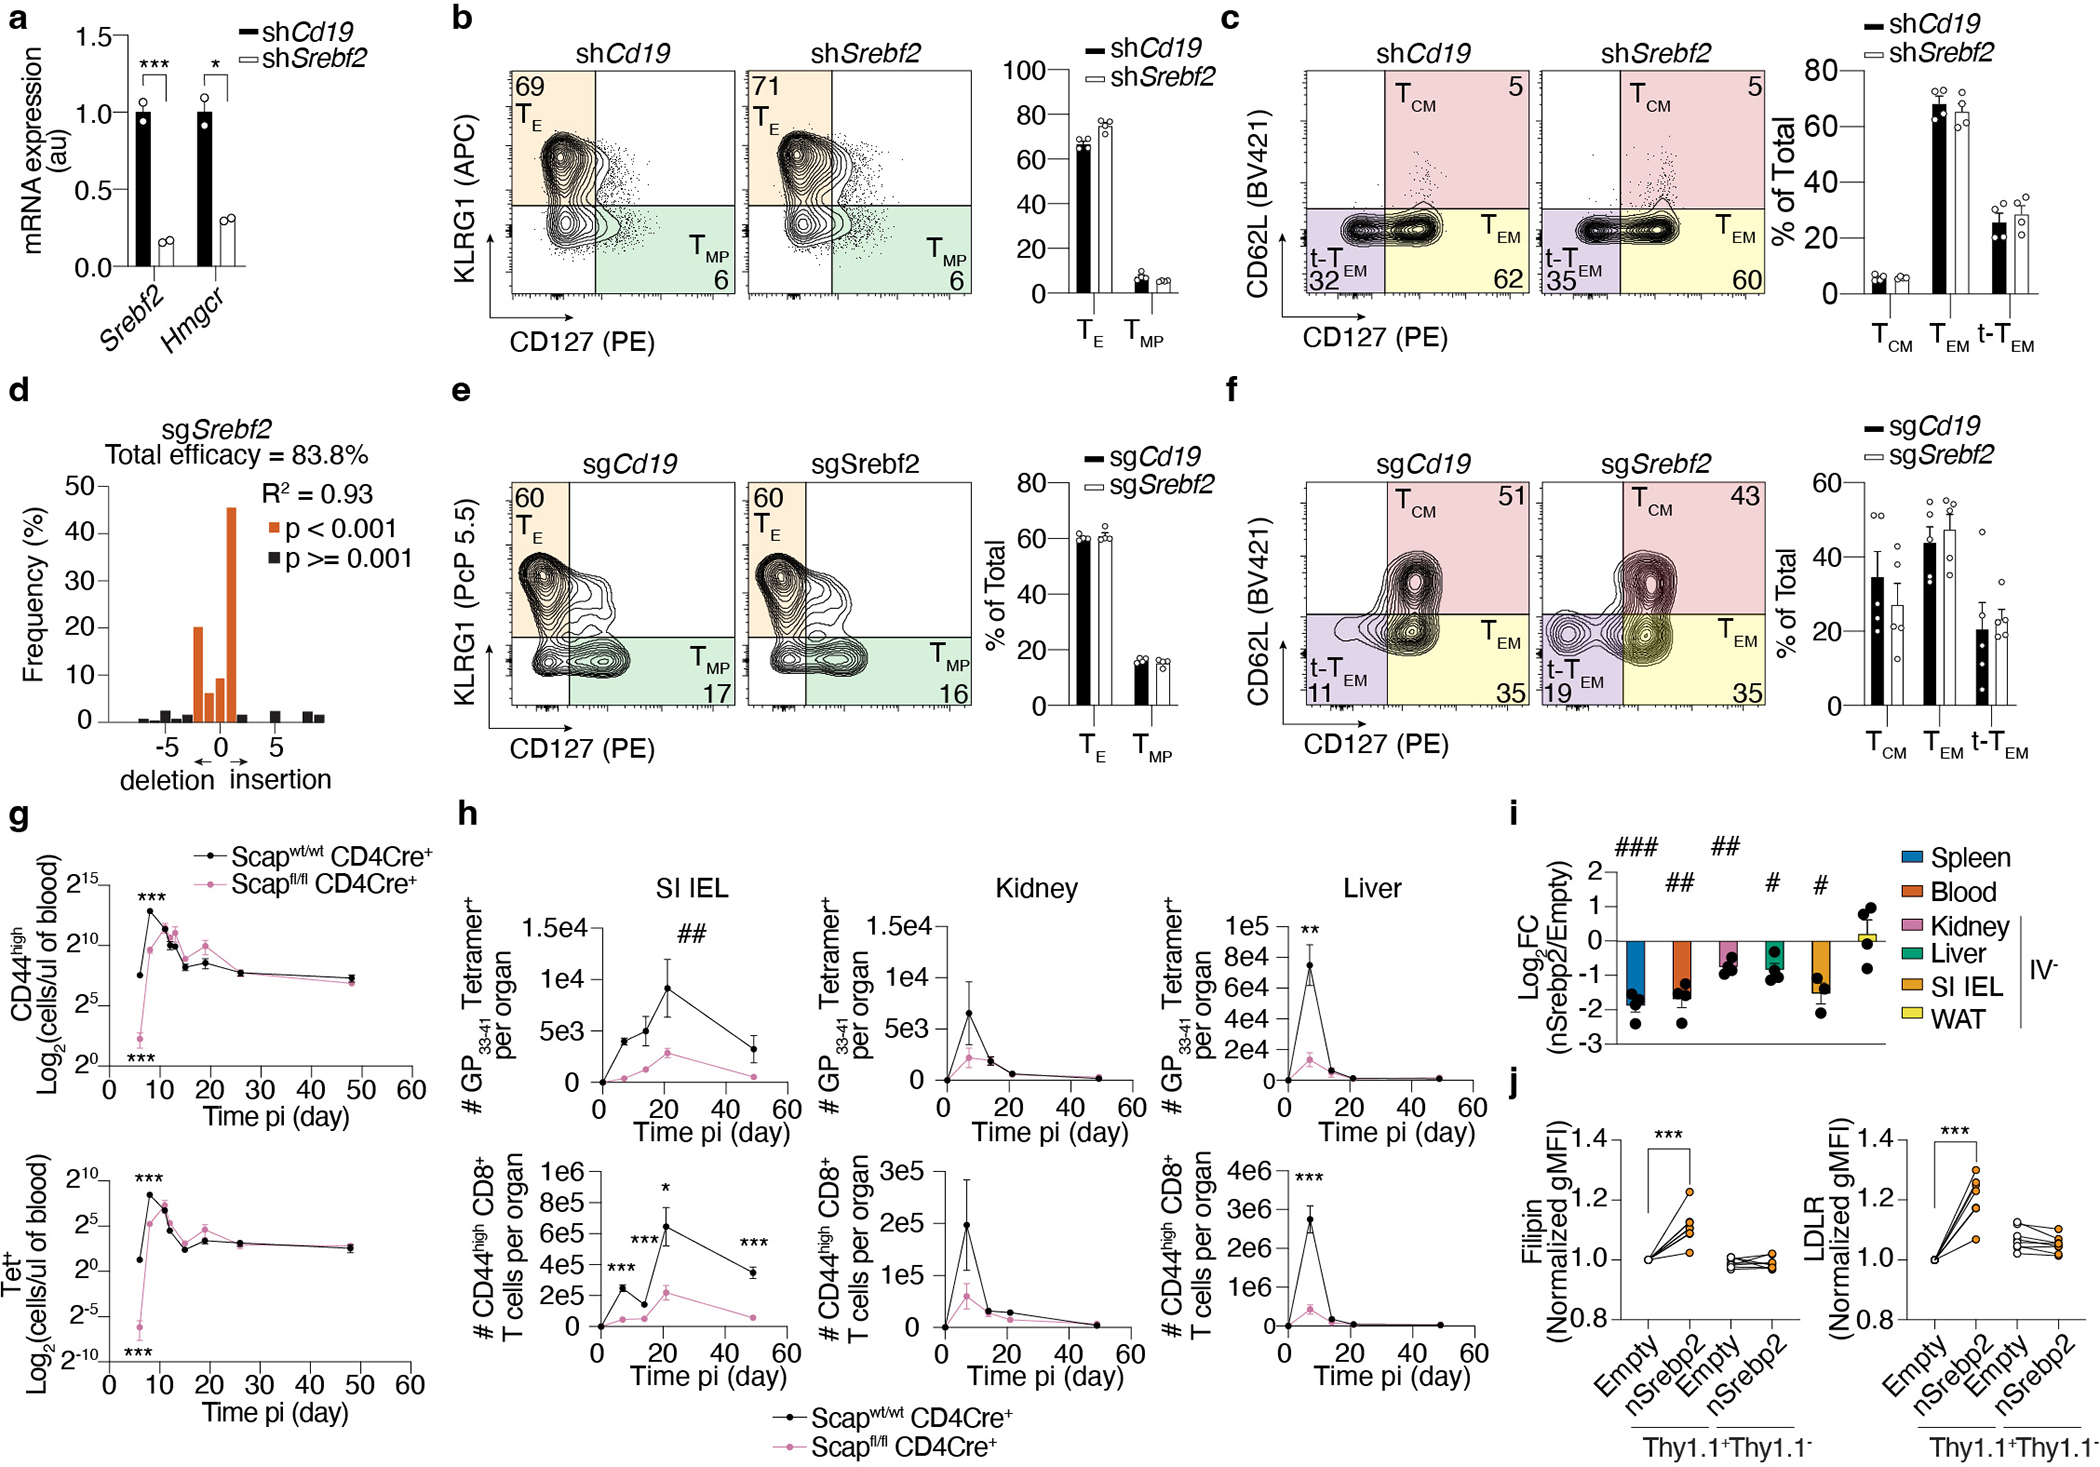
Extended Data Figure 3. A Srebp2-dependent metabolic program controls SI TRM formation.

a, Quantification of gene expression by qPCR of shRNAmir control (shCd19) or shSrebf2 shRNAmir P14 CD8 T cells before adoptive transfer. b, Frequency of effector shRNAmir control (shCd19) or shSrebf2 shRNAmir P14 CD8 T cell populations in the spleen 7 days after LCMV infection. c, Frequency of memory shRNAmir control (shCd19) or shSrebf2 shRNAmir P14 CD8 T cell populations in the spleen 21 days after LCMV infection. d, CRISPR/Cas9-mediated indel efficiency of the Srebf2 sgRNA construct on sorted transduced P14 cells before adoptive transfer. e, Frequency of effector sgCd19 or sgSrebf2 P14 cell populations in the spleen 7 days after LCMV infection. f, Frequency of memory sgCd19 or sgSrebf2 P14 cell populations in the spleen 21 days after LCMV infection. g, Total cell quantification of CD44high CD8 T cells (left) and Tet+ CD8 T cells (right) in the blood of Scap WT or Scap KO at different time points after LCMV infection. h, Total cell quantification of Tet+ CD8 T cells (upper) and CD44high CD8 T cells (lower) in SI, kidney, and liver of Scap WT or Scap KO at different time points after LCMV infection. i, Ratio of congenically distinct P14 CD8 T cells transduced with a constitutively active nuclear form of human Srebp268 (nSrebp2) or an empty vector (Empty) from indicated tissues 7 days after LCMV infection. j, Flow cytometry analysis of cholesterol content by Filipin stain (left), and LDLR expression in P14 CD8 T cells transduced with a bicistronic construct encoding Thy1.1 alone or Thy1.1 and nSrebp2 (right). P14 CD8 T cells from the kidney, liver, WAT, and SI were gated on the IV− population (h and i). Data are mean +/− s.e.m. and representative of at least two independent experiments, with a total of n=2 (a), n=4 (b-e), n=5 (f), n=6 (WT) and n=7 (Scap KO) (g and h), n=4 (i and j) mice and n=2 (d) cell replicates. Two-sided unpaired (a, d, g, and h) and paired (j) t-Test. *P<0.05, **P<0.01, ***P< 0.005. Two-sided one-sample t-Test (i) #P<0.05, ##P<0.01, ###P< 0.005. Two-way ANOVA (h) ##P<0.01.
