
Figure 6:
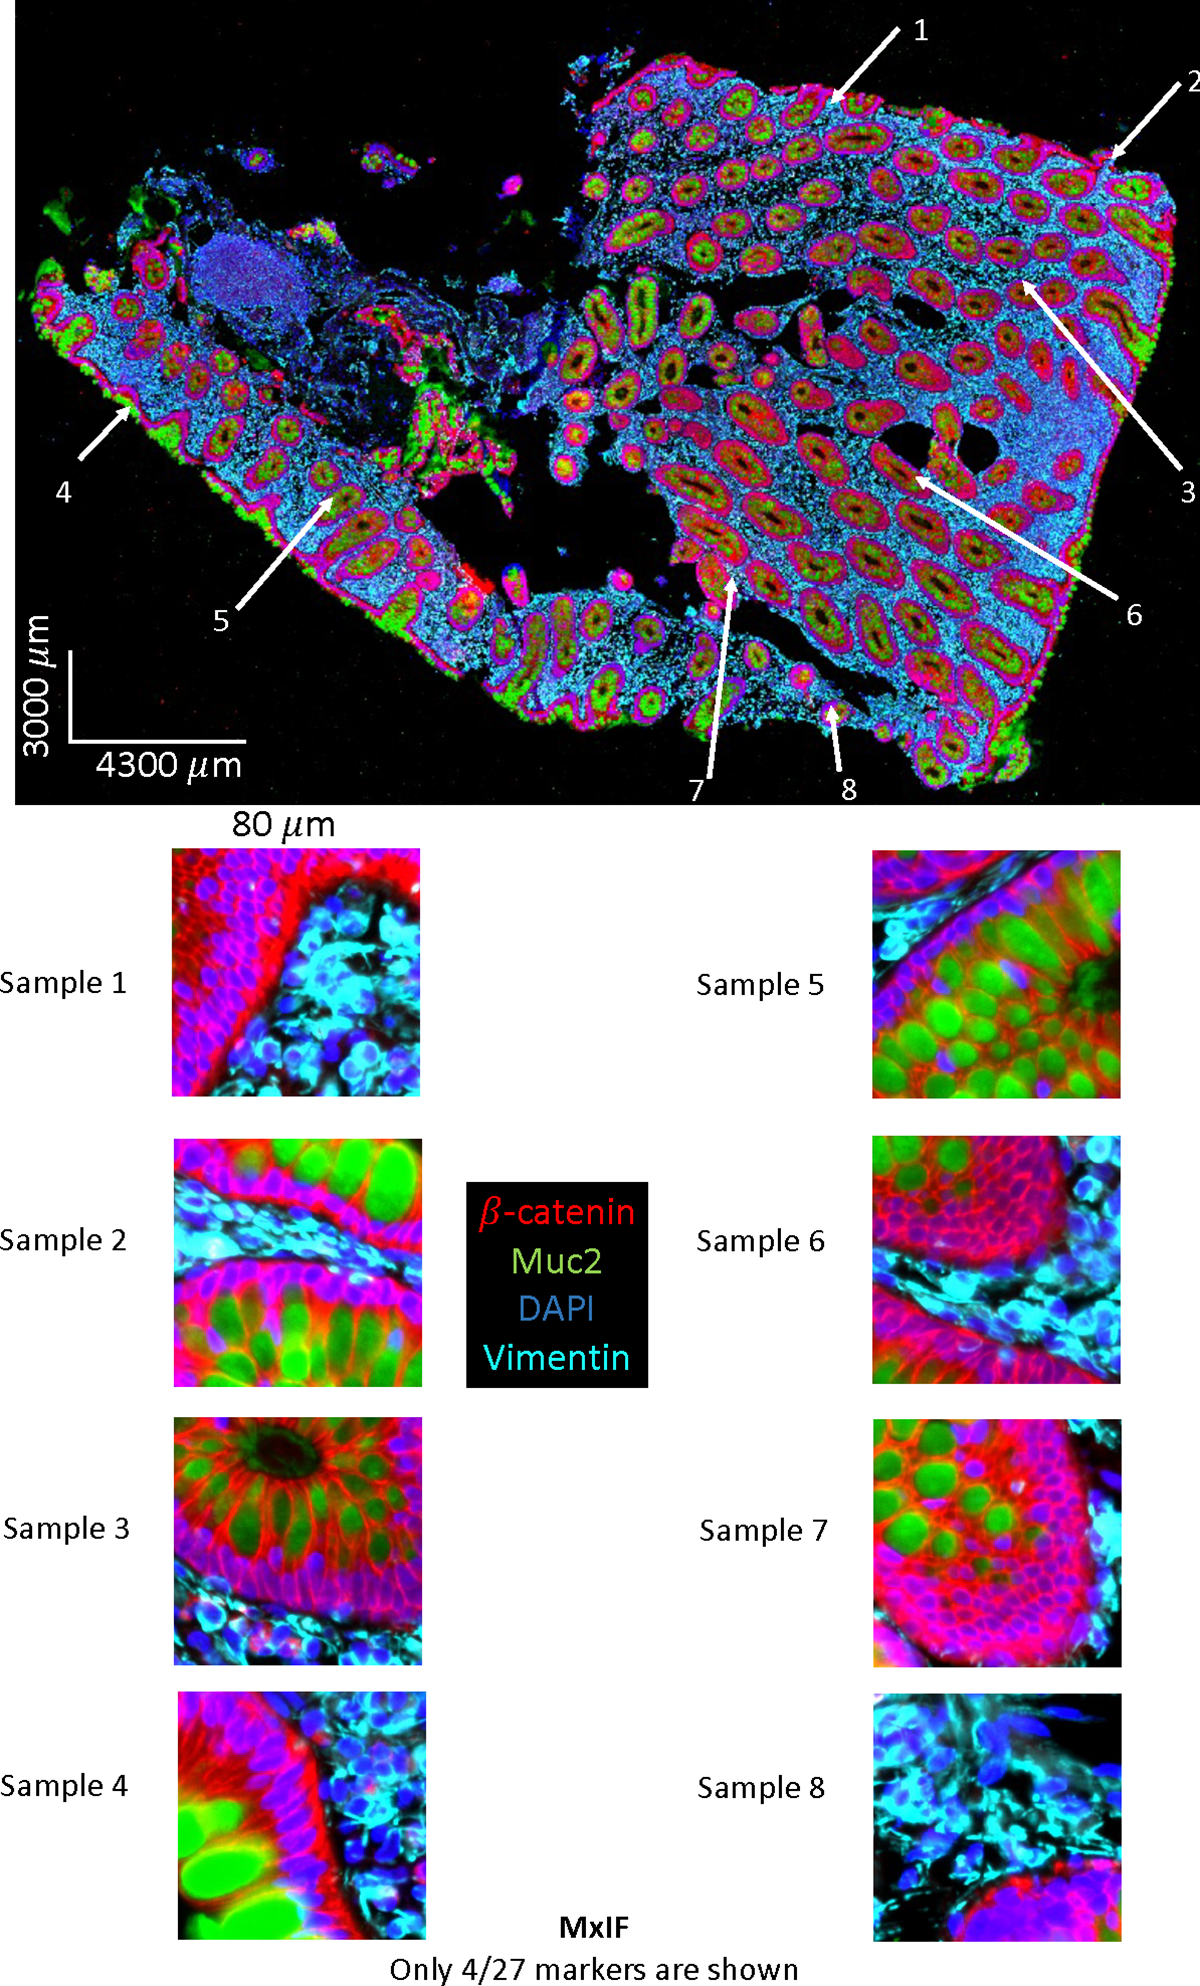
Selective field of view on MxIF WSI data. Only 4 (out of 27 stains) markers are chosen for visualization. The intensity are adjusted for illustration purpose.
Official websites use .gov
A
.gov website belongs to an official
government organization in the United States.
Secure .gov websites use HTTPS
A lock (
) or https:// means you've safely
connected to the .gov website. Share sensitive
information only on official, secure websites.
Selective field of view on MxIF WSI data. Only 4 (out of 27 stains) markers are chosen for visualization. The intensity are adjusted for illustration purpose.