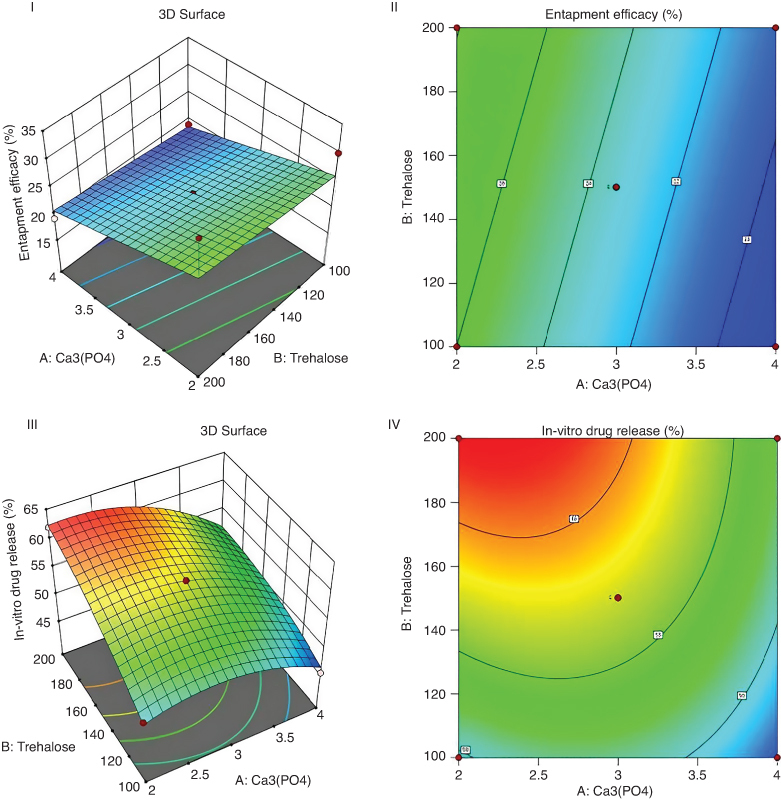
Figure 1.

Response surface plot and counter plot of relationship between A:ca3(po4) and B:trehalose on entrapment efficacy(I & II) and in vitro drug release (III & IV) of formulation.
Indicates the magnitude of entrapped efficacy (%), Contour lines: Represent levels of drug release (%) corresponding to different combinations of Factor 1 and Factor 2.
ca3(po4): Calcium phosphate, color scale.
