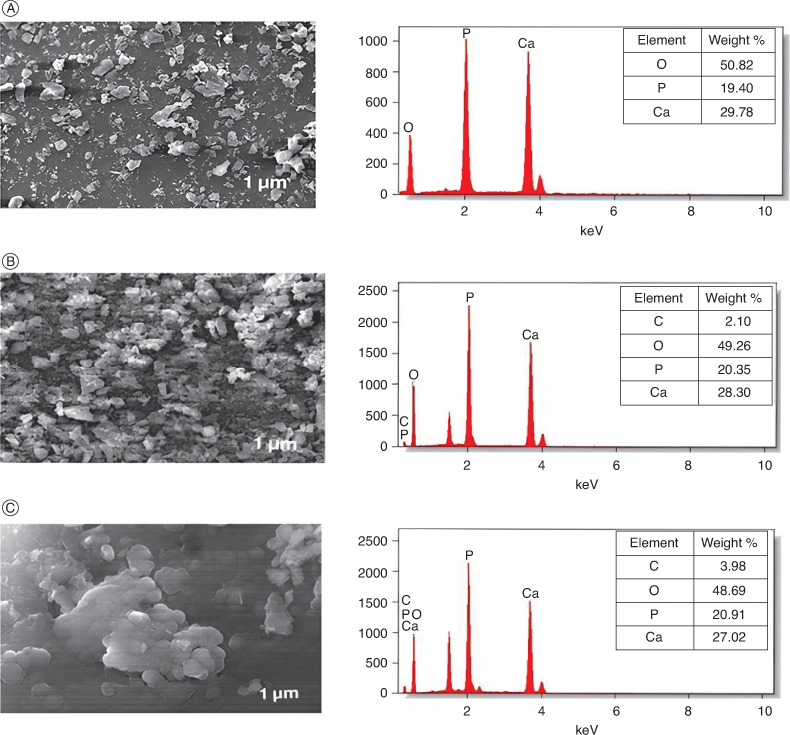
Figure 2.

SEM (left panel) and EDX (right panel) analysis of calcium phosphate core (A), trehalose coated core (B) and Cephalothin loaded aquasome (C).
SEM, which shows the presence of spherical calcium phosphate core in the nano range.
μm: Micrometer; KeV: Kilo-electron volt; SEM: Scanning electron microscopy.
