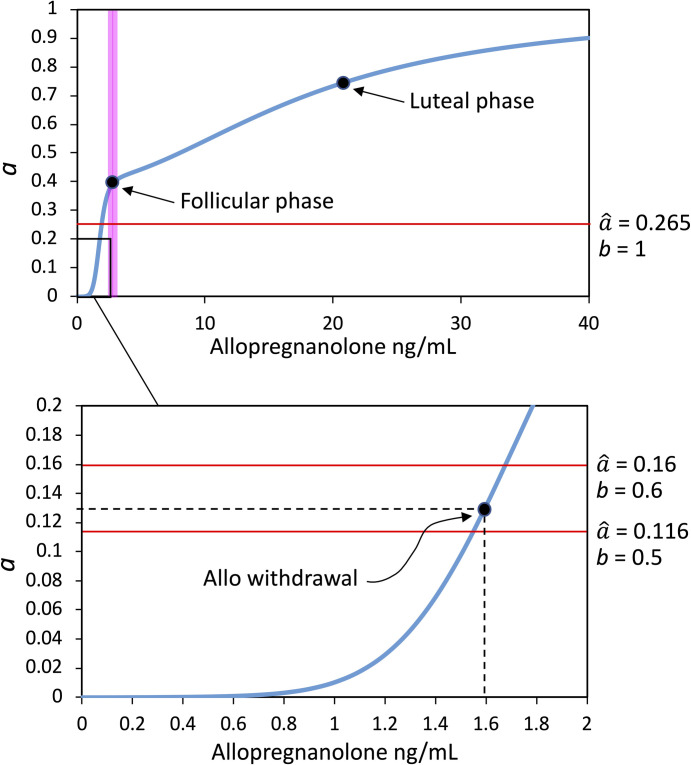
Fig 3. Relationship between estimated allopregnanolone brain levels and the strength of GABAergic transmission, expressed by the coefficient a, as derived from Eq (4).
Top panel. The pink band indicates the transition zone separating two ranges of allopregnanolone where different effects on the GABAA receptor are prevalent: In the lower range the effect on GABAA α4 subunit expression, while in the higher range the positive allosteric modulation on GABAA activity. The points corresponding to allopregnanolone concentrations and a values at the follicular and luteal phases, and the value of the bifurcation point at the maximal glutamatergic strength (), are indicated. Bottom panel. Zoom-in view of the bottom left inset in the top graph. The point corresponding to allopregnanolone withdrawal and related a value is indicated. The horizontal red lines indicate the values taken by the bifurcation point at half-maximal glutamatergic strength (), and for a 20% rise of b above this level (). At allopregnanolone withdrawal, the thalamocortical loop system is still monostable for b = 0.5 , but it becomes bistable for b = 0.6 .

