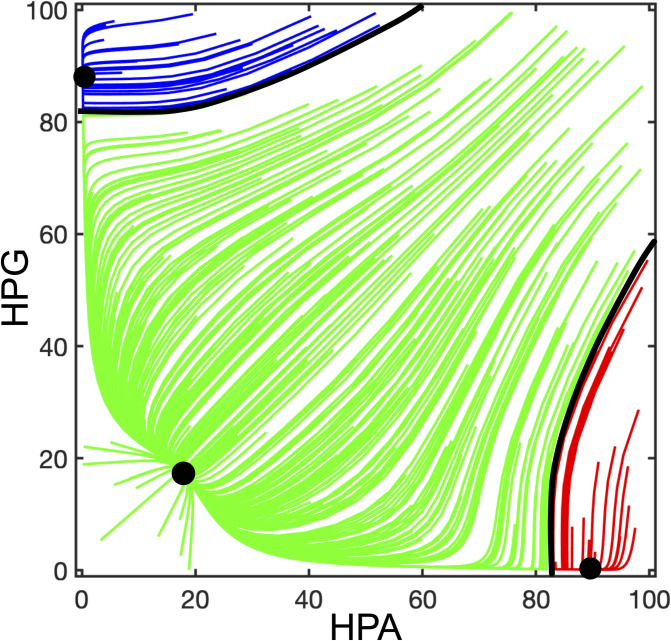
Fig 5. Phase portrait of the dynamic system representing the HPG-HPA interaction according to the diagram of Fig 4.
The trajectories of the dynamic system have been computed with MATLAB by using Eqs (7) and (8) with the parameters reported in Table 5. Initial conditions have been randomly selected to be representative of different possible evolutions of the system. Each trajectory converges to one of the three stable equilibrium points (black dots). Black lines mark the boundaries between the basins of attraction of the three equilibria. The basin of attraction of the equilibrium point with high HPA and low HPG activity (which attracts the red trajectories) is assumed to represent the functional states leading to the onset of FM.

