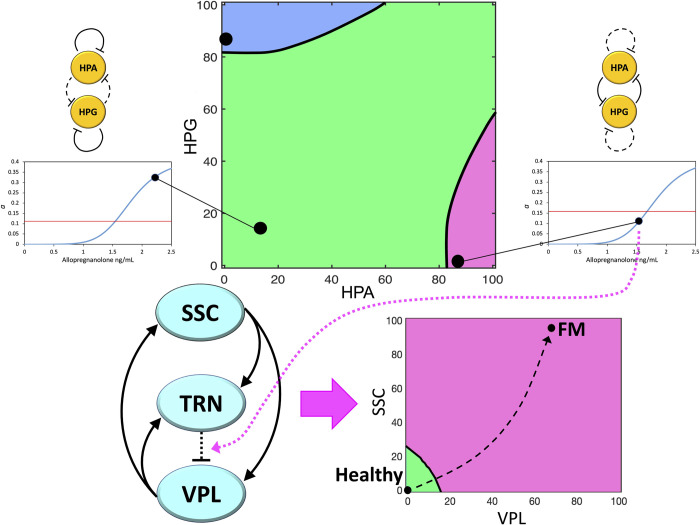
Fig 6. Global representation of transitions leading to FM pathogenesis according to our neuroendocrine multistable model.
Top strip: Phase portrait of the HPA/HPG loop system, showing three stable equilibria (main graph). The lower-left (circadian) and lower-right (pathogenic) equilibria are connected with corresponding points on the graphs of the relationship between allopregnanolone brain concentration and GABAergic strength a (side graphs). The red lines in the side graphs indicate the bifurcation values , showing that the lower-right equilibrium point in the phase space leads to a value . Bottom strip: The pain processing thalamocortical loop (left diagram), under the influence of the lower-right equilibrium point of the endocrine loop, crosses its bifurcation point, which leads to the appearance of two stable equilibria in its own phase space (right diagram). The high-firing-rate equilibrium represents the chronic pain condition and has a much wider basin of attraction. Therefore, once bistability has arisen, the thalamocortical system is prone to converging to the high-firing-rate equilibrium, thus causing the onset of FM symptoms. The variables considered in the endocrine phase space (top) represent the percent activities of the endocrine axes, e.g. estimated from the plasma levels of cortisol (HPA) and progesterone (HPG). The phase space shown in the bottom strip is a bidimensional projection on the VPL/SSC plane of the three-dimensional thalamocortical phase space, and the graph axes represent the percent firing rate above baseline of the thalamic ventroposterolateral nucleus (VPL) and the primary somatosensory cortex (SSC).

