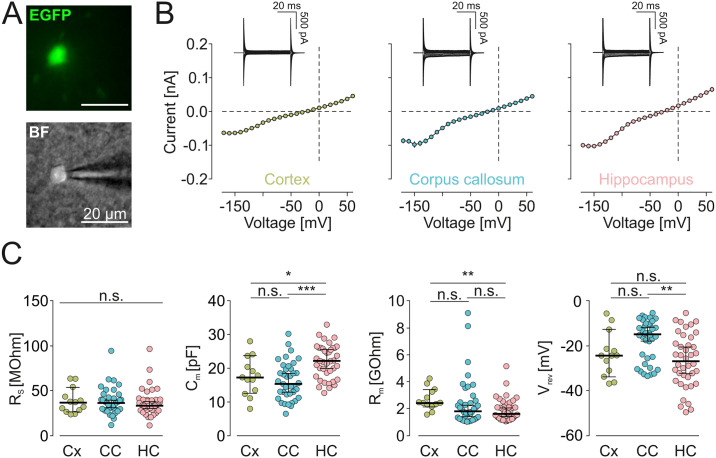
Fig 2. Electrophysiological data obtained before harvesting the cytoplasm for sequencing.
A EGFP Fluorescence (top) and brightfield image (BF, bottom) of a microglial cell approached by a patch pipette. B (Inset) Samples of membrane currents from microglial cells clamped for 50 ms to a series of de- and hyperpolarizing voltages ranging from -170 mV to +60 mV from a holding potential of -70 mV. Cells were recorded in cortex, hippocampus and corpus callosum as indicated. (Main) Based on the recorded membrane currents, average current-voltage relationships for all patch-clamped cells in the notified region were constructed. C Summary of series resistances (Rs; left), capacities (Cm; middle left), membrane resistances (Rm; middle right) and reversal potentials (Vrev; right) of microglia from cortex (Cx), corpus callosum (CC) and hippocampus (HC). Significant differences are indicated by *** (p<0.001) and * (p = 0.029), non-significance is indicated by n.s. Significance was tested by Kruskal-Wallis followed by a Dunn´s test. P-values were as followed: Rs: Cx-CC:>0.9999, Cx-HC:>0.9999, CC-HC:>0.9999.; Cm: Cx-CC:>0.9999, Cx-HC:0.0402, CC-HC:<0.0001; Rm: Cx-CC:0.0654, Cx-HC:0.0088, CC-HC:>0.9999; Vrev: Cx-CC:0.2137, Cx-HC:>0.9999, CC-HC:0.0022.

