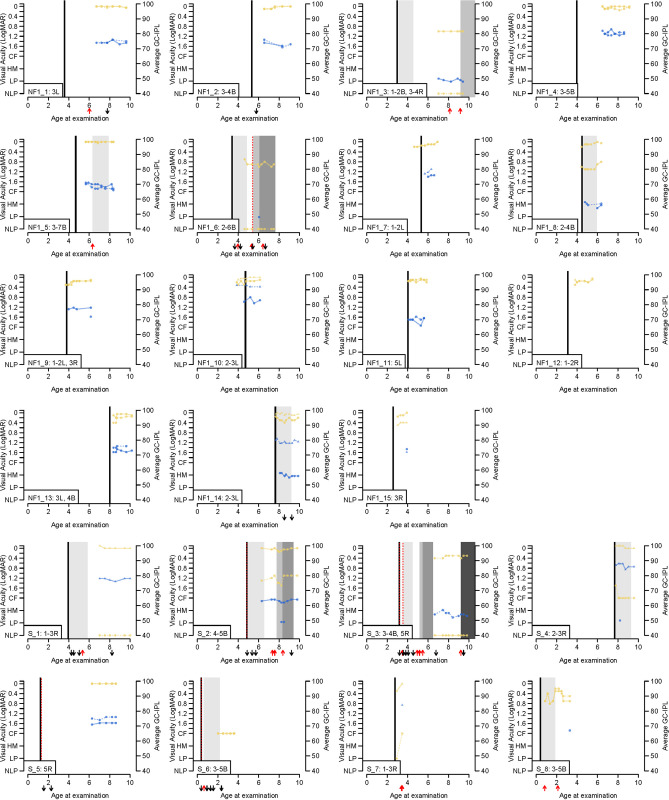
Fig 3. Graphs present longitudinal VA and GC-IPL measurements obtained during the study period.
CF: count fingers (LogMAR = 2.0); GC-IPL: ganglion cell inner plexiform layer; HM: hand movement (LogMAR = 2.5); LE: left eye; LP: light perception (LogMAR = 3.0); NF1: neurofibromatosis type 1; NLP: no light perception (LogMAR = 3.5); RE: right eye; S: sporadic optic pathway glioma. Different anatomic locations of optic pathway gliomas. Extension of tumors: (1) intraconal (posterior boundary orbital apex); (2) intracanalicular (posterior boundary optic foramen); (3) intra‐cranial‐prechiasmatic; (4) chiasmatic; (5) optic tract; (6) lateral geniculate nucleus; (7) optic radiation; B: both left och right, L: left; R = right.

