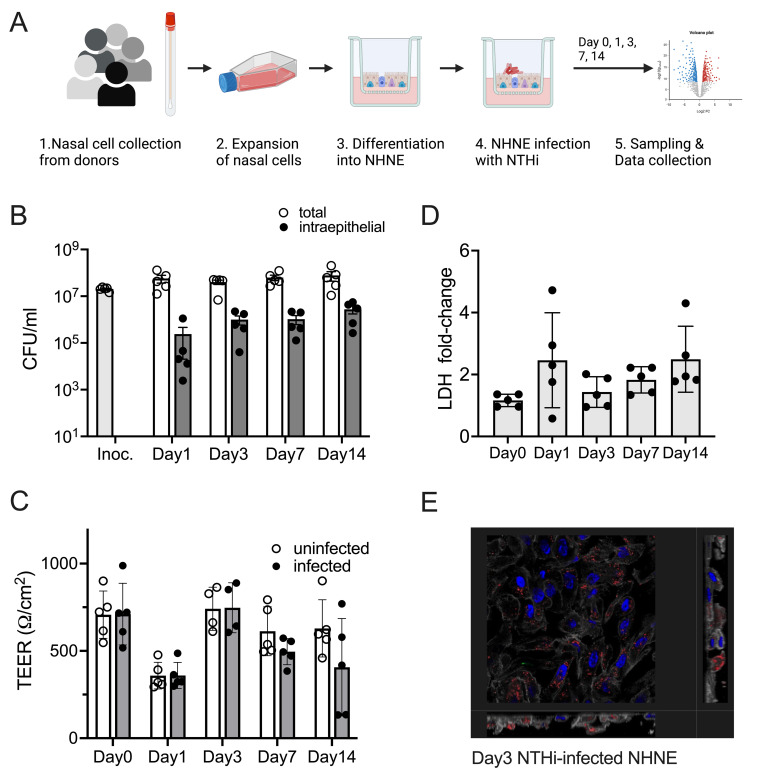
Fig 1. Infection of NHNE from five healthy human donors with H. influenzae strain 86-028NP Panel A: Schematic representation of experimental workflow.
Prepared with BioRender.com. Panel B: Bacterial loads during infection. Total bacterial and intraepithelial bacterial loads (CFU/mL) were determined on Day 1, Day 3, Day 7 and Day 14. Each dot represents the average CFU/mL observed for each donor (n = 2 biological replicates for each donor and condition). ‘Intraepithelial’ bacteria comprise both intracellular and paracellular bacterial populations. Bars and error bars indicate average CFU/mL and standard error. Inoc is the CFU/mL in the bacterial inoculum used to infect NHNE. Panel C: Transepithelial resistance (TEER) changes resulting from NHNE infection. TEER readings for uninfected and infected NHNE for all donors are shown. Due to instrument failure, no readings were available for Donor 1 samples on Day 3 of infection. Average reading and standard error are shown. Panel D: Changes in LDH-release in infected NHNE. LDH levels in infected and uninfected samples were determined using AlphaLISA. The fold change in infected compared to uninfected NHNE from each donor is shown, averages and standard error are shown. Panel E: Immunofluorescence Microscopy of infected NHNE. Representative image showing a Day3 infection of a donor 3 sample. White–Phalloidin stand of filamentous actin; Blue–cellular nuclei, DAPI stain; Green–TUNEL labelling; Red–anti-NTHi antibody. Additional microscopy images for other days of infection are shown in S2 Fig. In Panels A, B &C, data plotted for each timepoint represent the average of multiple biological replicate measurements for samples from an individual donor.

