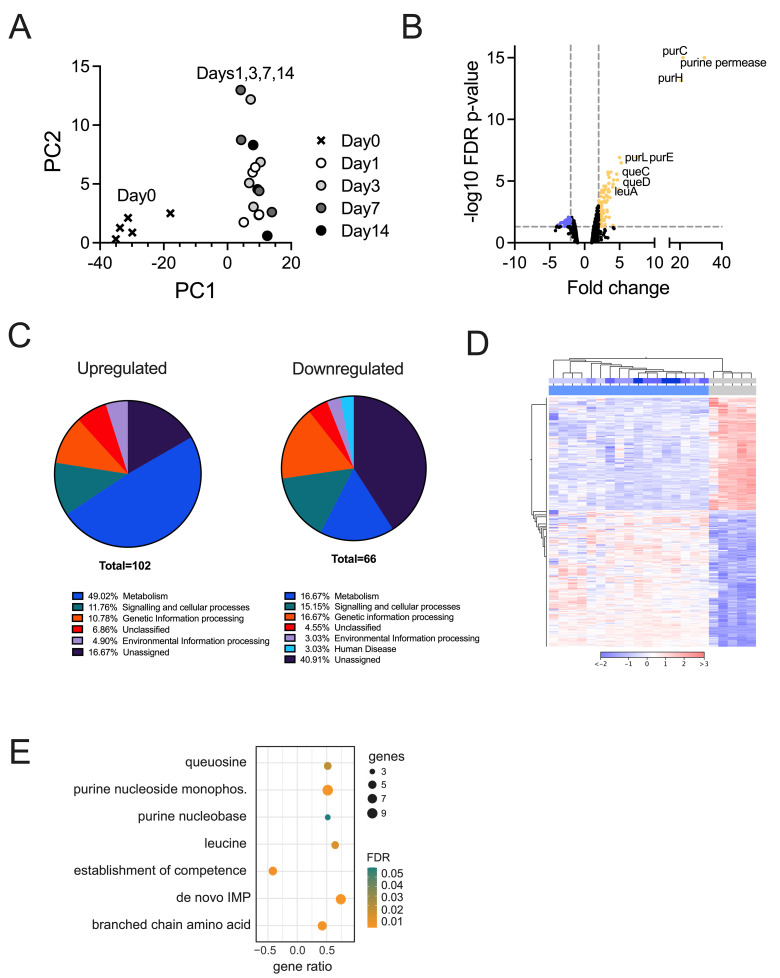
Fig 2.
Remodelling of the NTHi 86-028NP transcriptome during NHNE infection Panel A: PCA plot for NTHi whole transcriptome data. Panel B: Volcano plot of Differentially Expressed Genes (DEGs) for comparison of the combined day1-day14 samples against the pre-infection state (‘day0’). Colours indicate genes with at least a 2-fold change in expression (down-blue, up-yellow) and an FDR p-value <0.05. Panel C: Distribution of NTHi DEGs into functional categories using KEGG Orthology. Results were generated using BlastKOALA. Panel D: Heatmap and dendrogram for NTHi DEGs (2-fold change, FDR p-value <0.05). Metadata bars at the top of the heatmap: Lower bar–infected (blue) and uninfected (grey) samples, top bar–time post-infection, day0 / uninfected—grey, day1 to day14 –increasingly deeper shades of blue. Panel E: GO-term enrichment for NTHi DEGs identified in the uninfected vs infected (all) comparison. The GO term enrichment was generated using geneontology.org.

