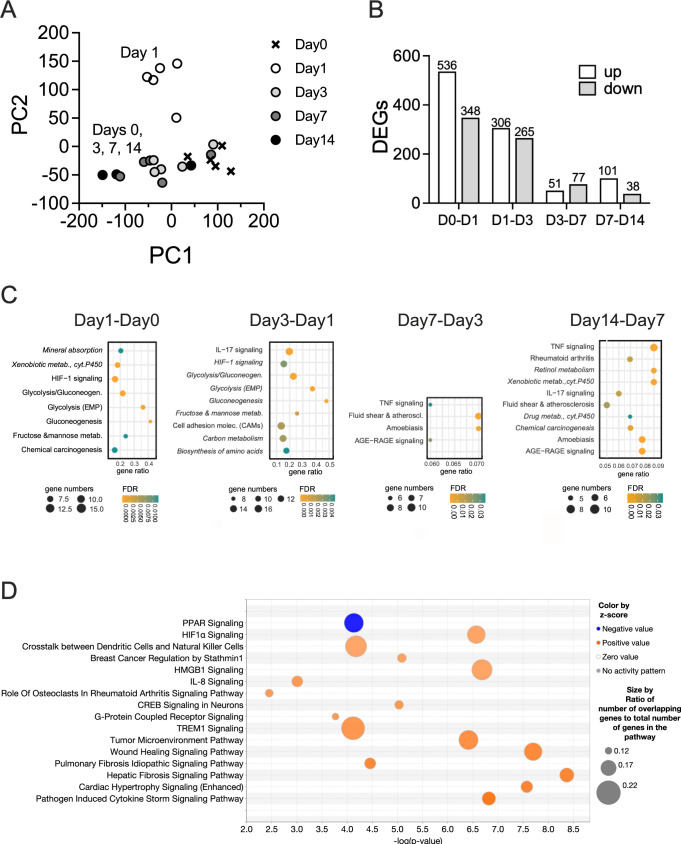
Fig 3. NHNE responses to NTHi infections.
Panel A: PCA plot Panel B: Numbers of DEGs identified in NHNE over time. DEGs (≥2 fold expression change, Bonferroni p<0.05) were determined relative to the previous time point. Panel C: Gene Ontology analysis showing processes up- (regular font) and down-regulated (italics) in NHNE over time. Gene Ontology analyses used TOPPFUN, Panel D: Overrepresented pathways on day1 p.i. compared to day0 of NHNE infection. Pathways were identified using IPA (Qiagen) Canonical pathway analysis. Pathways with z-scores of 3.0 or higher and an FDR p-value <0.05 are shown. Pathways are displayed in ascending order of z-scores. Z-scores above 2.0 were considered significant.

