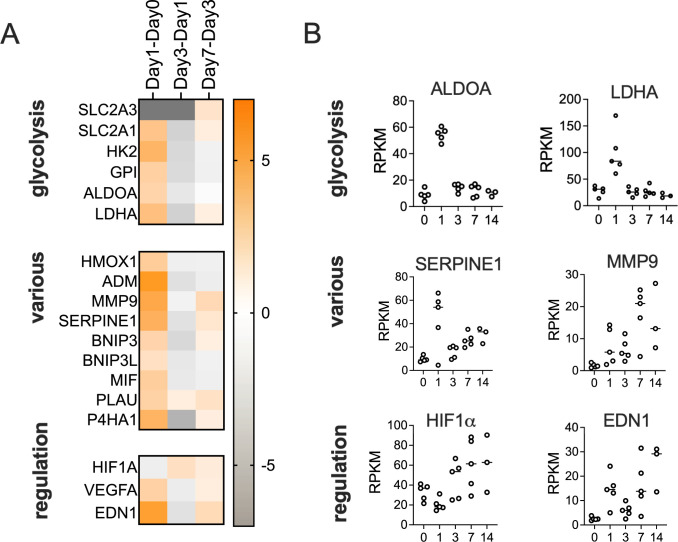
Fig 4.
Hypoxia-driven NHNE response to infection on day1 p.i. Panel A: Heatmap showing fold changes in the expression genes involved in various relevant functions. Fold changes were determined using IPA canonical pathway analyses (Qiagen). Panel B: RPKM data for selected genes that show high fold-changes in expression on day1 compared to day0. Expression patterns of several regulators and effectors are complex and show clear changes both on day1 and later during the infection.

