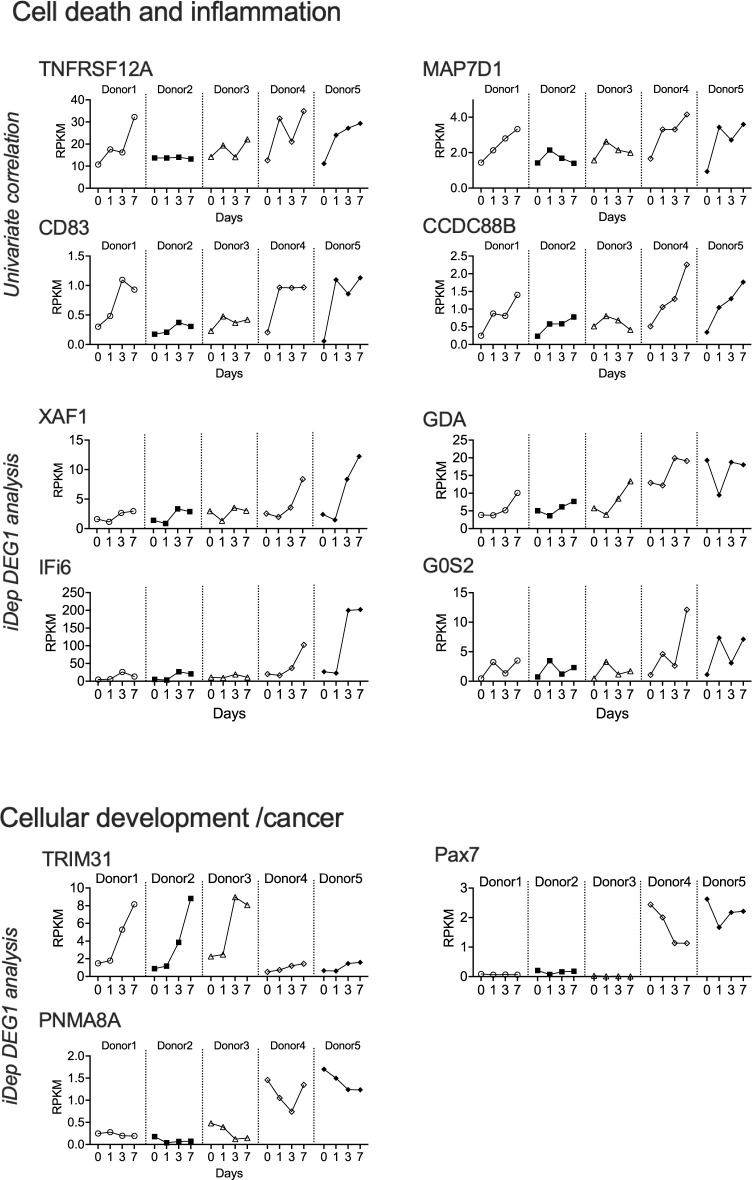
Fig 6. DEGs associated with NTHi susceptible donors 4 & 5.
RPKM patterns are shown for each donor from day0—day7. DEGs were identified using either univariate Pearson’s correlation or the iDEP DEG1 tool. For the univariate correlation analysis, only genes with a max RPKM > 1 are shown. All genes had absolute Pearson coefficient values of at least 0.75.

