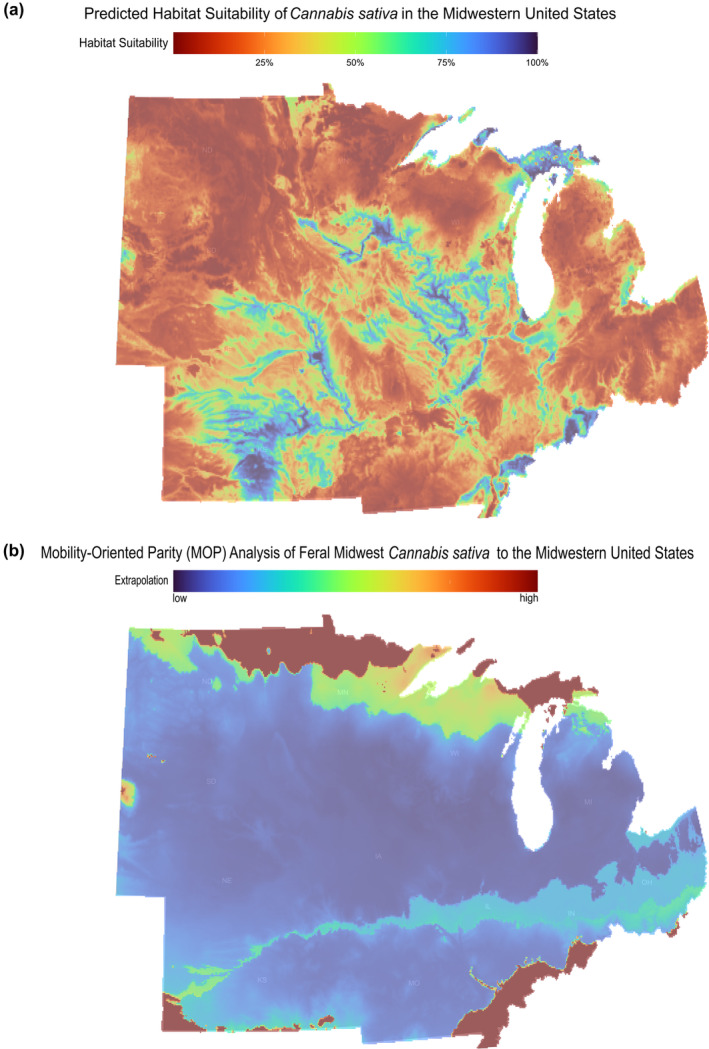
FIGURE 2.

(a) Abiotic suitability heatmap for Cannabis sativa in the Midwestern United States. Areas in blue represent high abiotic suitability, and areas in red represent low abiotic suitability. (b) Mobility‐oriented Parity Analysis of the Calibration Region to the Entire Midwestern United States. Areas in blue and green represent low extrapolation, and areas in orange and red represent high extrapolation.
