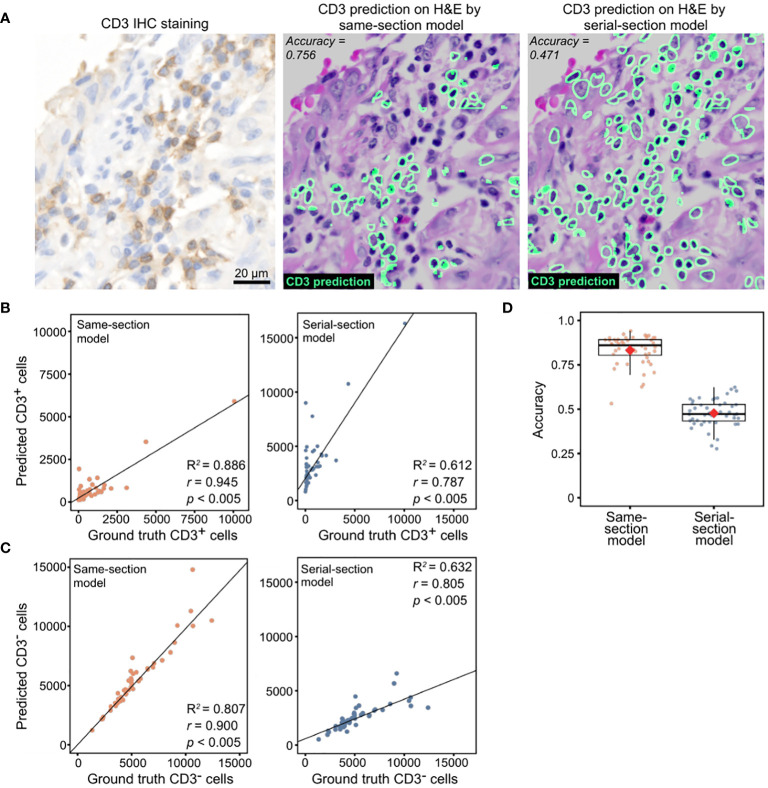
Figure 2.
Model performance evaluation using an in-house lung cohort with IHC ground truth. (A) Representative images of CD3+ cell predictions by same-section and serial-section models with the corresponding CD3 IHC stain. (B) CD3+ cell counts predicted by same-section and serial-section models compared with ground truth cell counts acquired from CD3 IHC stain using Pearson’s correlation analysis. Diagonal dashed lines denote the best-fit line using Huber’s regression model. (C) CD3- cell counts predicted by same-section and serial-section models compared with ground truth cell counts acquired from CD3 IHC stain using Pearson’s correlation analysis (r and p values shown). Best-fit lines and R2 values obtained with Huber’s regression model are shown. (D) Accuracy of same-section and serial-section model predictions. The boxplot shows the interquartile range (box), with the maximum values within 1.5 interquartile range from the upper and lower quartiles marked by the upper and lower whiskers, respectively. The red diamonds mark the mean values.

