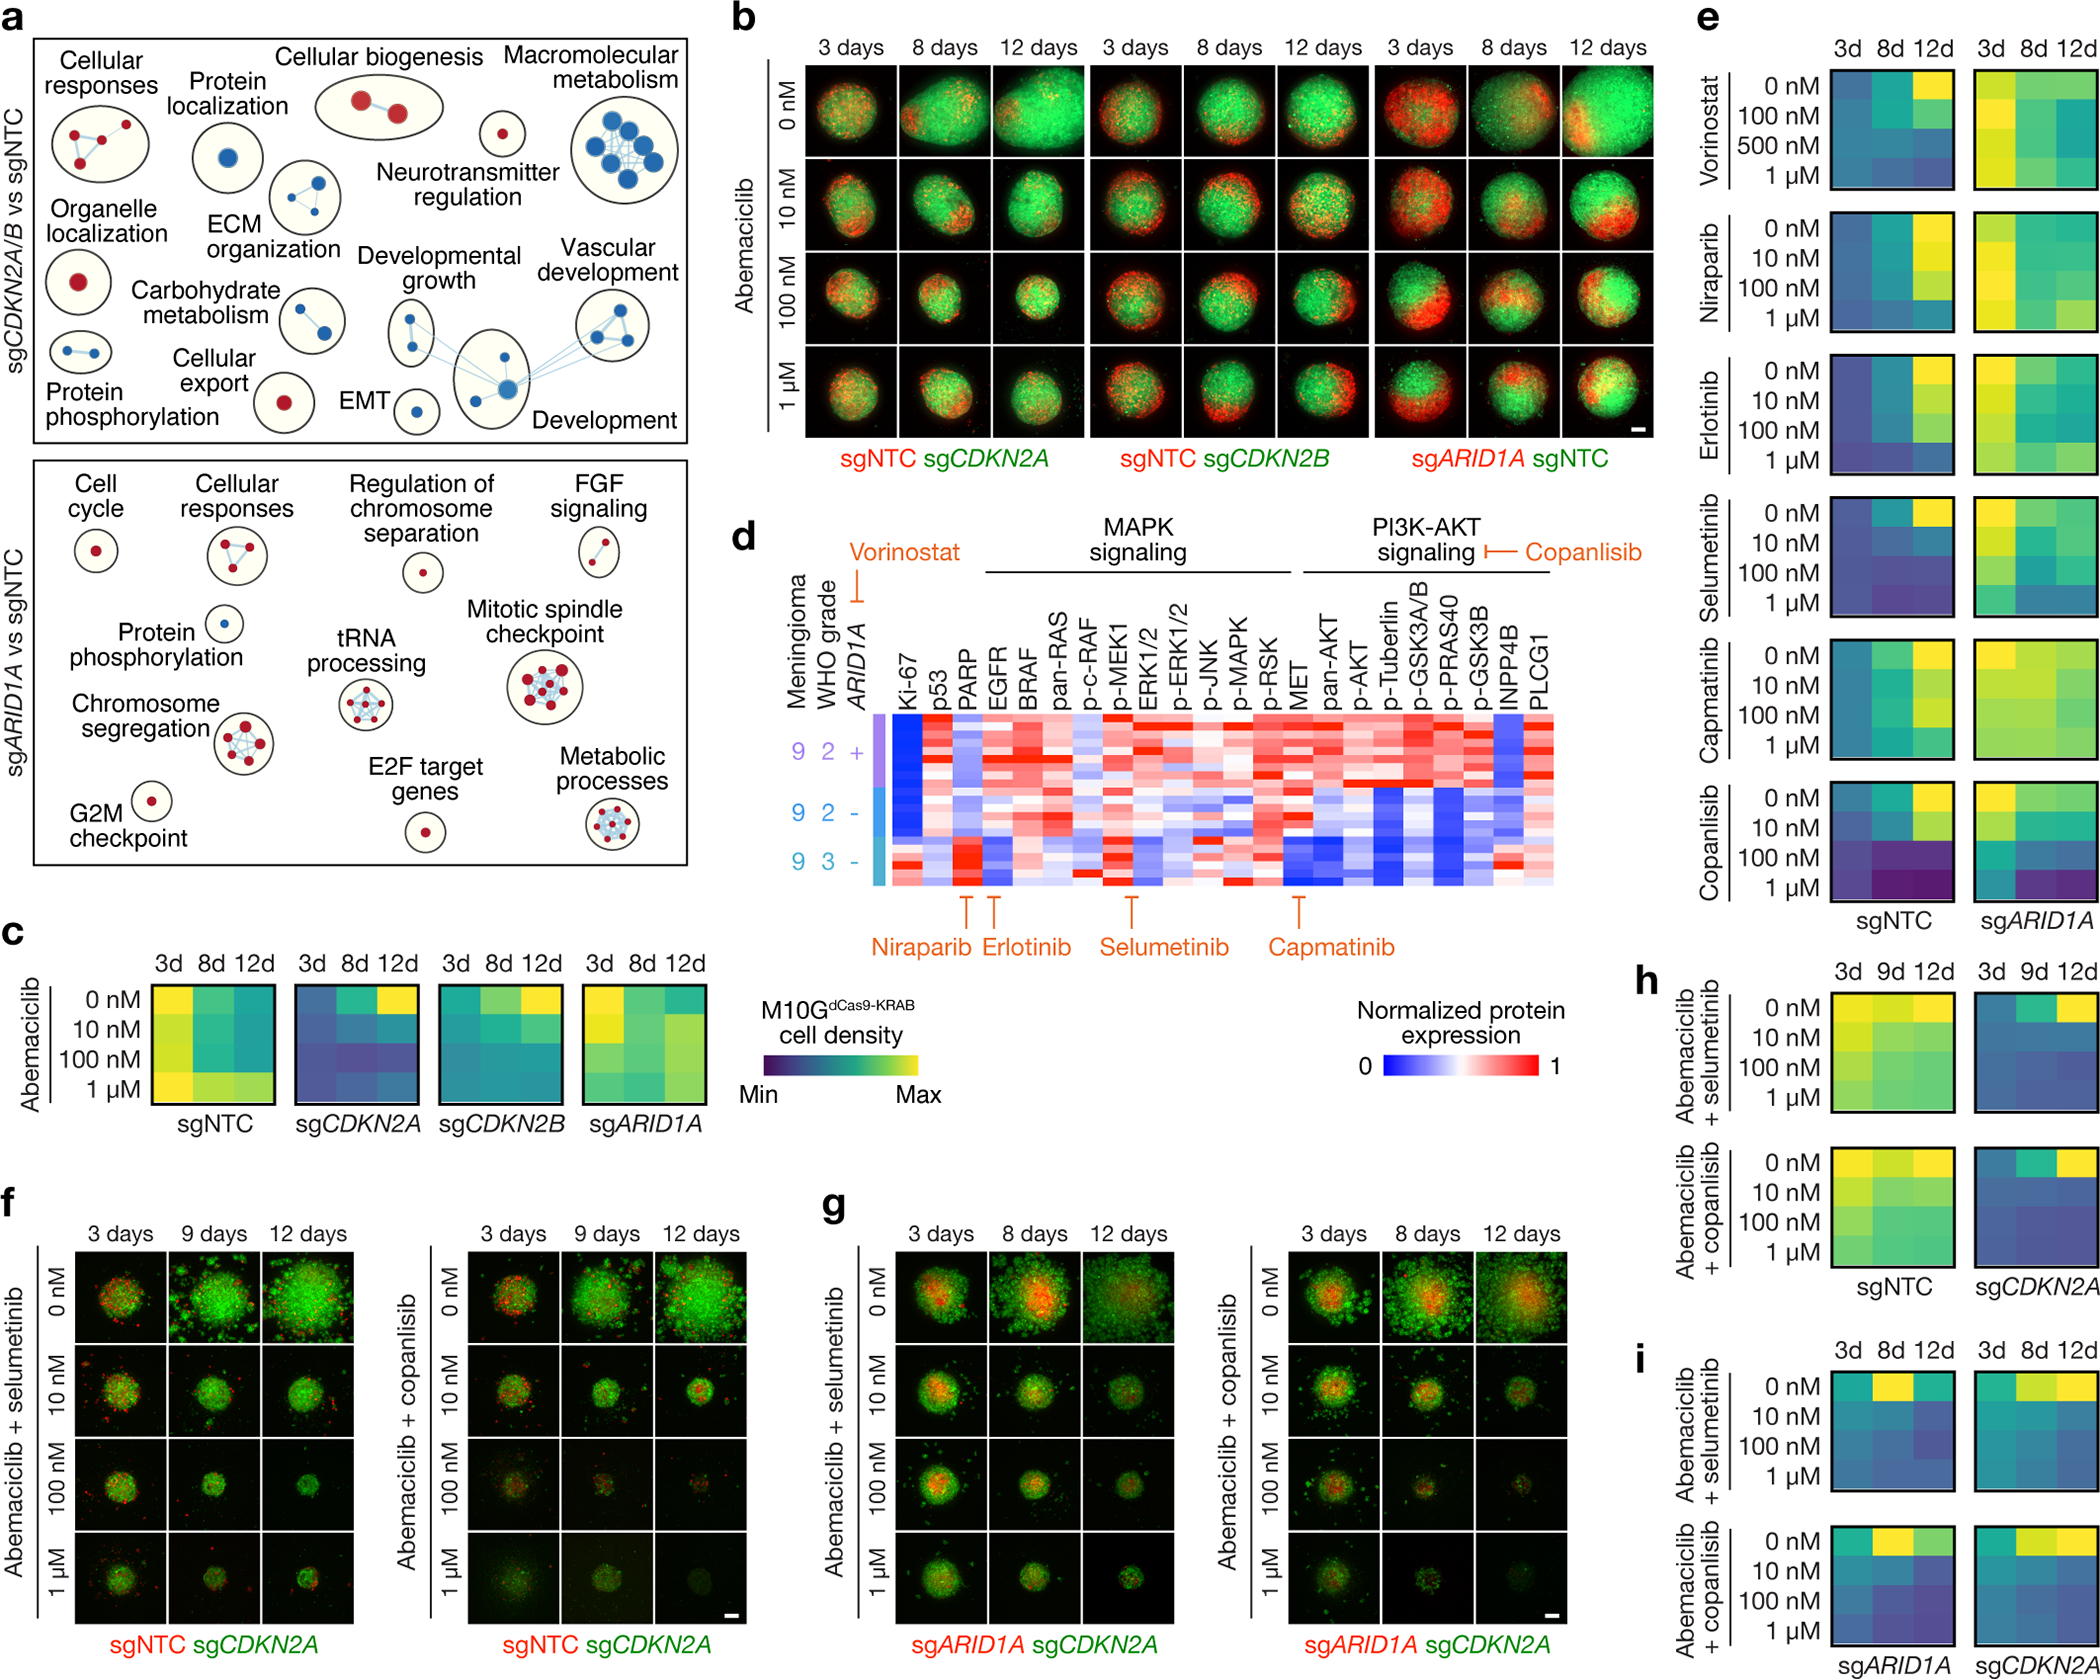
Fig 7. A preclinical platform for testing personalized systemic therapies to overcome intratumor heterogeneity in high-grade meningiomas.

a, Network of gene circuits distinguishing M10GdCas9-KRAB meningioma cells expressing sgNTC (n=3), sgCDKN2A (n=3), sgCDKN2B (n=3), or sgARID1A (n=3) using RNA sequencing. Nodes represent pathways and edges represent shared genes between pathways (p≤0.05, FDR≤0.05). Red nodes are enriched and blue nodes are suppressed in experimental versus sgNTC control conditions. b, Abemaciclib treatments of 3D co-cultures of M10GdCas9-KRAB meningioma cells expressing sgNTC, sgCDKN2A, sgCDKN2B, or sgARID1A. Scale bar, 100μm. c, Quantification of abemaciclib treatments of 3D co-cultures of M10GdCas9-KRAB meningioma cells expressing sgNTC, sgCDKN2A, sgCDKN2B, or sgARID1A. Representative of 8–10 biological replicates per condition. d, Differentially expressed spatial proteins from M9 (all with Student’s t test, one-sided, p≤0.05 for at least 2 of 3 regionally distinct comparisons). e, Quantification of molecular therapy treatments of 3D co-cultures of M10GdCas9-KRAB meningioma cells expressing sgNTC or sgARID1A. Representative of 8–10 biological replicates per condition. Scale from c. f, Combination molecular therapy treatments of 3D co-cultures of M10GdCas9-KRAB meningioma cells expressing sgCDKN2A or sgNTC. Scale bar, 100μm. g, Combination molecular therapy treatments of 3D co-cultures of M10GdCas9-KRAB meningioma cells expressing sgCDKN2A or sgARID1A. Scale bar, 100μm. h, Quantification of combination molecular therapy treatments of 3D co-cultures of M10GdCas9-KRAB meningioma cells expressing sgCDKN2A or sgNTC. Representative of 8 biological replicates per condition. Scale from c. i, Quantification of combination molecular therapy treatments of 3D co-cultures of M10GdCas9-KRAB meningioma cells expressing sgCDKN2A or sgARID1A. Representative of 8 biological replicates per condition. Scale from c.
