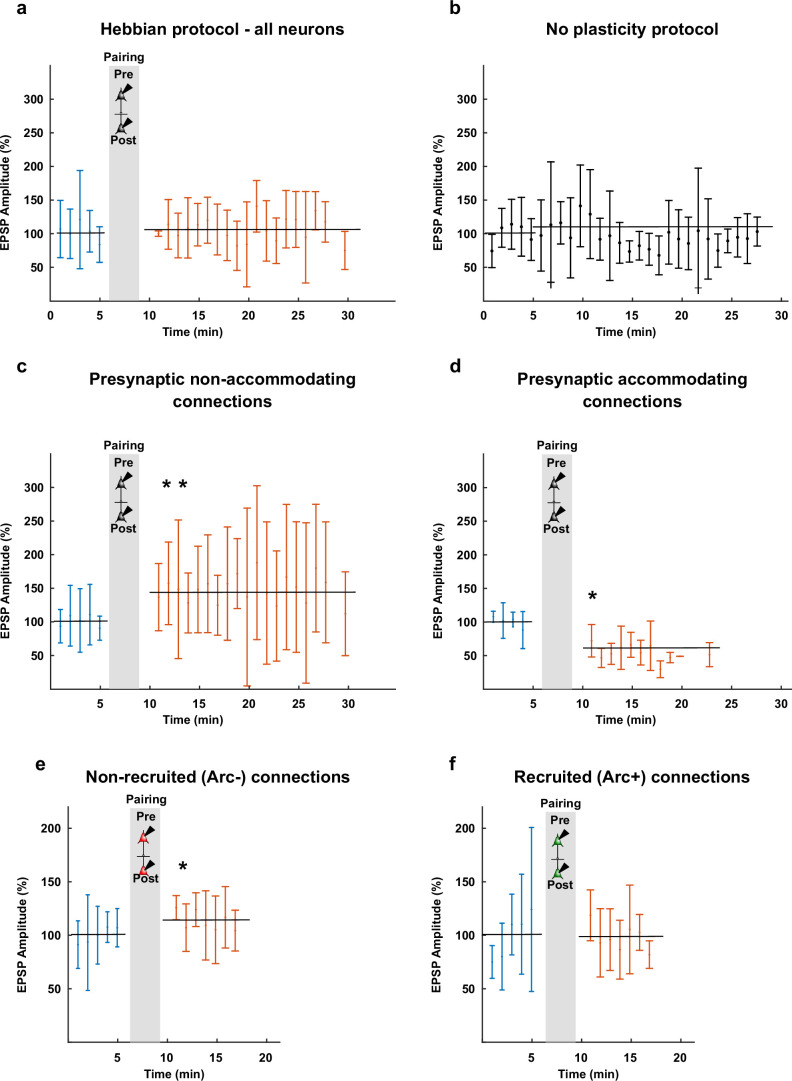
Extended Data Fig. 5. Long-term measurements of synaptic strength.
a, Average (n = 20) long term recording of evoked EPSP amplitudes (normalized to baseline) before (blue) and after (red) induction of changes in synaptic strength through the Hebbian pre- and postsynaptic pairing (gray). No changes were observed (1 data point = 1 min average for 3 samples every 20 seconds); Two-tailed Mann-Whitney U test on the five averaged values before and after the pairing, U = 12; P > 0.05, n = 20 b, Average (n = 10) long term recordings of evoked EPSC amplitudes (normalized to first 5 minutes) show that no plasticity occurs spontaneously, without the application of a Hebbian protocol; Two-tailed Mann-Whitney U test on the five averaged values before and after the pairing, U = 7; P > 0.05, n = 10. c, as in Fig. a, including only connections with a presynaptic non-accommodating neuron; here, we observed potentiation after Hebbian pre- and postsynaptic pairing; Two-tailed Mann-Whitney U test on the five averaged values before and after the pairing, U = 0; P = 0.0079 (**), n = 11 d, as in Fig. a, including only connections with a presynaptic accommodating neuron showing depression of synaptic strength. Two-tailed Mann-Whitney U test on the four values before and five averaged values after the pairing, U = 0; P = 0.0159 (*), n = 6. e, as in Fig. a, for connections not recruited after CS-US association; Two-tailed Mann-Whitney U test on the five values before and after the pairing, U = 3; P = 0.0278 (*), n = 6. f, as in Fig. a, for connections recruited after CS-US association; One-tailed Mann-Whitney U test on the five values before and after the pairing, U = 11; P > 0.05, n = 4. Error bars are s.d.

