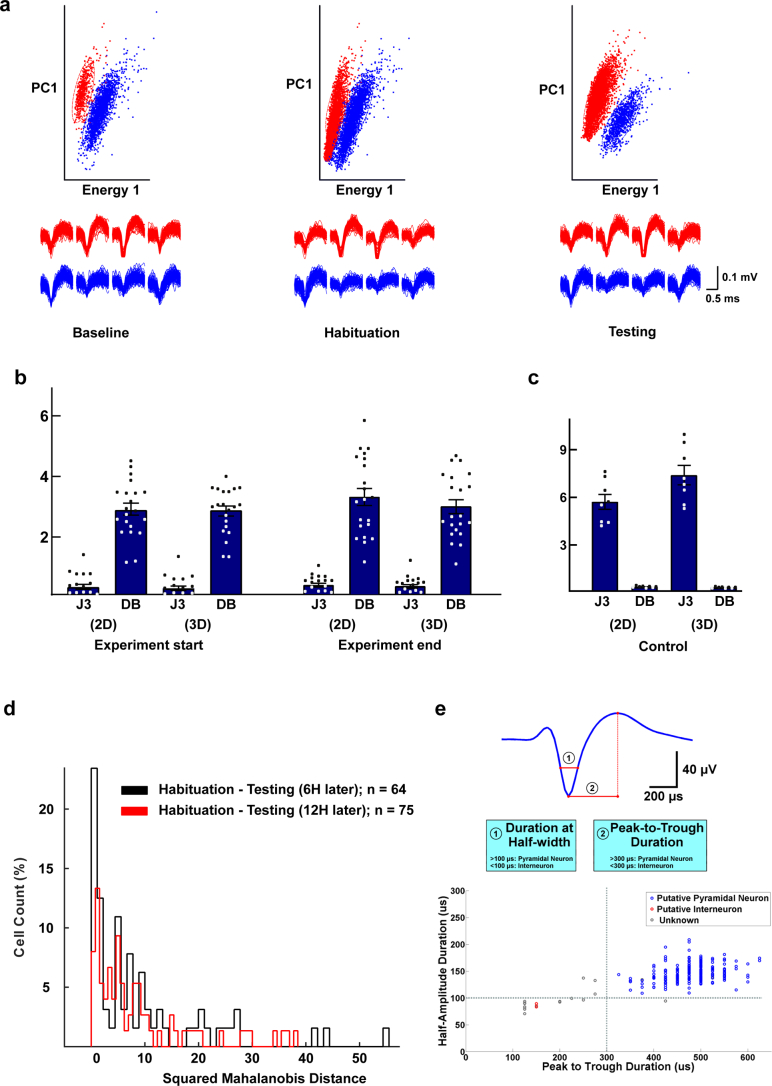
Extended Data Fig. 10. In vivo recordings – tracking neurons over time.
a, Two isolated (red and blue) units originating from the same tetrode, as determined by (top) principal component (PC) and energy analysis. The units were recorded throughout baseline (left), habituation (middle) and testing (right). Bottom, representative waveforms of the recorded neurons. b, Cluster stability was assessed by measuring the J3 and Davies-Bouldin (DB) statistics in 2-dimension (2D) principal component space and 3-dimension (3D) principal component space, at the start and end of experiments (see M&M). Bars are means ± sd; n = 21 clusters. c, As negative controls to Fig. b), J3 and DB statistics were calculated from eight arbitrary clusters of similar shape and size that were defined from the central spheroid of principal component space (that is noise)25. Bars are means ± sd; n = 8. d, To ensure that the same neuron was recorded over multiple sessions, we quantified the squared Mahalanobis distance, discarding neurons with unstable values across sessions. e, Extracellular waveform used as a criterion for distinguishing between interneurons and pyramidal neurons based on the clusters obtained by plotting ‘half-amplitude duration’ against ‘peak to trough duration’.

