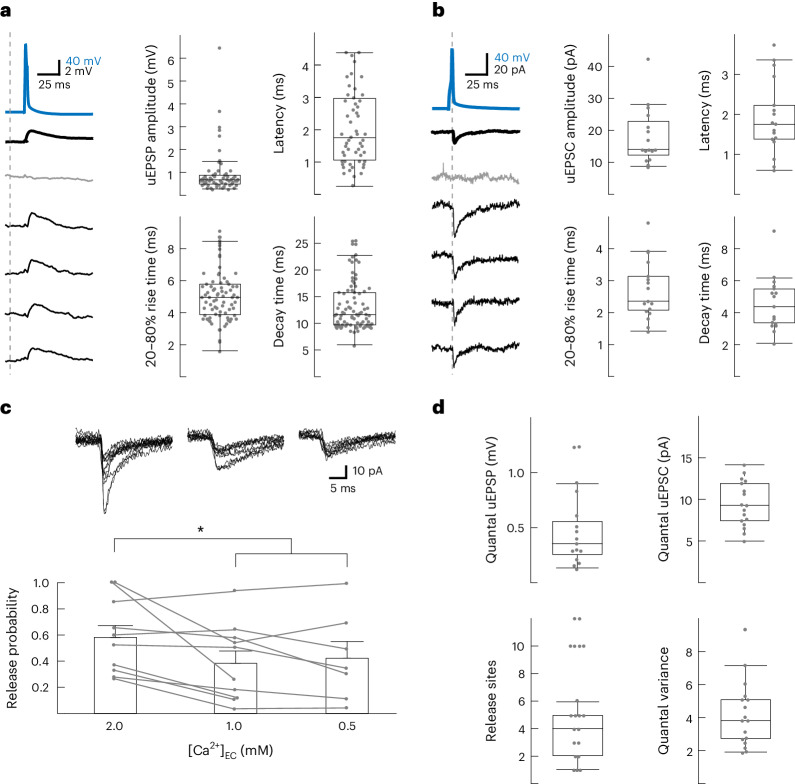
Fig. 2. Functional connectivity within the LA.
a, Left: Example of a presynaptic AP (blue) evoking a uEPSP (bold = 15-trial average, including failures) with individual traces (one failure in gray and four successes). Right: uEPSP characteristics (n = 81 connections), excluding failures. Centers represent medians, and whiskers represent 1.5× interquartile range. b, As in a but with unitary evoked postsynaptic current (uEPSC). Centers represent medians, and whiskers represent 1.5× interquartile range. c, Release probability as a function of extracellular Ca2+ concentration. Top: Ten example traces per connection. Data were analyzed by repeated measures analysis of variance (RM-ANOVA), F2,15 = 5.411, P = 0.017 and Tukey corrected *P = 0.033 or *P = 0.0349 for 2 mM versus 1 mM and 0.5 mM, respectively. Bar graphs show mean + s.e.m.; [Ca2+]EC, extracellular Ca2+ concentration d, Quantal parameters extracted based on a simple binomial model (Methods). Centers represent medians, and whiskers represent 1.5× interquartile range; N = 85 rats; Recordings were acquired in 14- to 19-day-old Wistar rats of both sexes.

