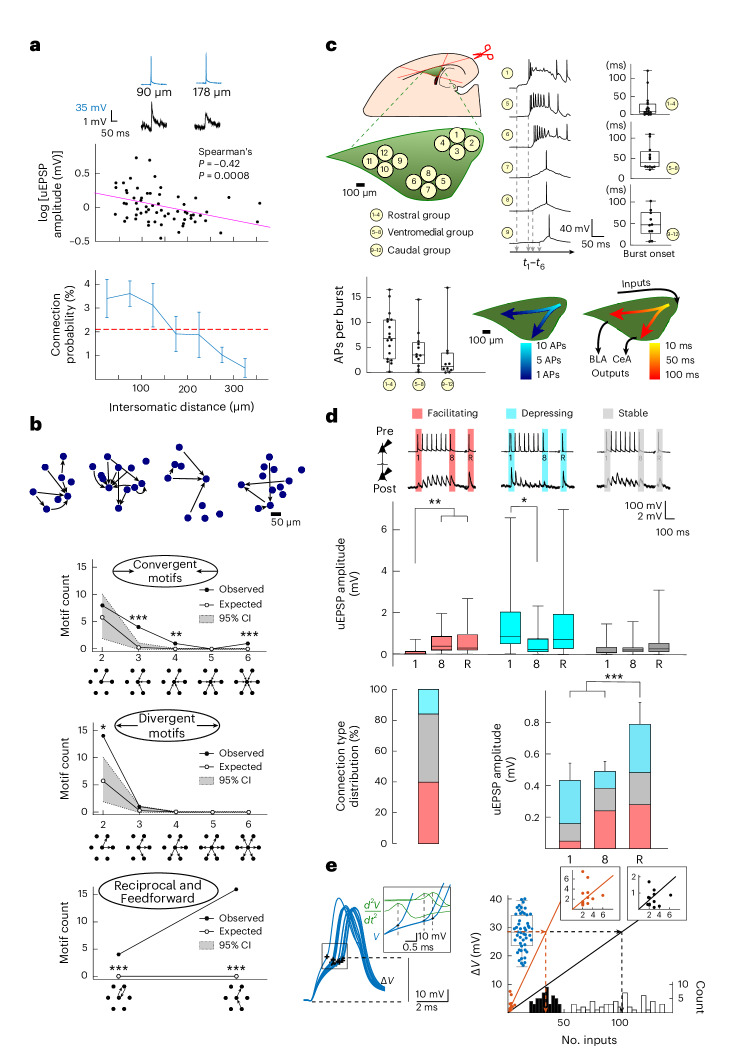
Fig. 3. LA network organization and intra-LA signal propagation.
a, uEPSP amplitude and connection probability decrease over distance. Inset: Examples of AP–uEPSP pairs (637 neurons, 89 connections, 34 rats; P = 0.0008). b, Top: Diverse examples of motifs with preserved cell positions. Bottom: observed (black circles) and expected (white circles) connectivity motifs (100,000 Monte Carlo simulations; Methods and Supplementary Note 3; gray, 95% confidence interval (95% CI)); *, **, and *** represent outside the 95%, 99% and 99.9% confidence intervals around the simulated values (line connecting the white dots), respectively. c, Top: Recordings in three LA (green) regions, with example bursting activity and corresponding averaged burst onsets per group of pipettes (n = 6 experiments with 18, 12 and 10 connections in clusters 1–4, 5–8 and 9–12, respectively). Bottom left: APs per burst per region. Bottom right: overlays of APs per burst and burst onset (Supplementary Note 4). Box plots indicate mean (middle line), 25% and 75% quartiles and maximal and minimal values (whiskers). BLA, basolateral amygdala; CeA, central amygdala. t1–t6, times of burst onsets for the samples. d, Top: Examples of facilitating, depressing and stable connections (n = 29, 12 and 41, respectively) and uEPSP amplitudes (average of 15 traces including failures; data were analyzed by RM-ANOVA; facilitating: F2,56 = 24, **P = 0.0045 (stimulus 1 versus stimulus 8 or 0.0015 (stimulus 1 versus stimulus 9) after Bonferroni correction); depressing: F2,22 = 7, *P = 0.032 Bonferroni corrected; stable: F2,93 = 2; P > 0.05). Box plots indicate mean (middle line), 25% and 75% quartiles and maximal and minimal values (whiskers). Bottom left: Connection type distribution. Bottom right: Average uEPSP depolarization per input, with relative contribution of facilitating phenotypes (RM-ANOVA; F2,144 = 11, P < 0.0001; ***P = 0.0002 and ***P = 0.009 for stimulus 9 versus stimulus 1 and versus stimulus 8, respectively, after Bonferroni correction; n = summed connections for 1, 2–8 and recovery (R) uEPSP from the top). Bars show mean ± s.e.m. e, Left: Voltage threshold analysis for AP initiation (ramp protocol; black, AP threshold). Inset: Calculation of time of AP initiation based on apex of second derivative. Right: Evoked uEPSP amplitudes against the number of inputs of convergent motifs (black circles, uEPSP1; red circles, uEPSPR). Insets: Magnification of the origin. A linear regression line was plotted from the summed convergent motif uEPSPs. Mean AP threshold values (blue circles) are projected (dashed line) on either regression line to construct the histogram distribution of inputs required to trigger a postsynaptic AP with either uEPSP1 (black) or uEPSPR (red); see Supplementary Note 5. Data are from the connections presented in d. Upper and lower limits of the boxes represent 75% and 25% values, with the whiskers extending to 100% and 0%. The middle lines represent the medians. Recordings were made in 14- to 19-day-old Wistar rats of both sexes.

