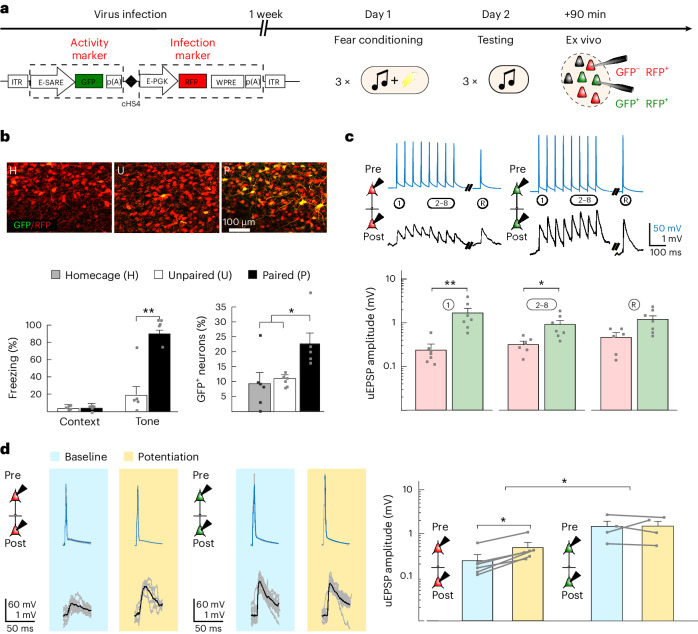
Fig. 5. CFC (in vivo)-induced ex vivo potentiation.
a, Virus infection protocol with stable (RFP) and dGFP (t1/2 = 2 h) under the E-SARE promoter, followed by CFC after 1 week (day 1), memory recall testing (day 2) and, within 90 min, brain extraction for imaging or electrophysiology. b, Top: GFP and RFP expression in LA slices of rats exposed to homecage or unpaired or paired tone–shock presentations. Bottom left: Freezing in response to the CS+ (one-tailed Mann–Whitney U-test; U = 0, **P = 0.0079; n = 5 rats). Bottom right: GFP+ neurons as a percentage of infected (RFP+) neurons (one-way ANOVA; F2,14 = 4.614, *P = 0.0075 and *P = 0.02 for paired versus unpaired and homecage after Bonferroni correction; n = 5 GFP+ neurons per slice for paired and n = 6 for unpaired and homecage conditions). c, Top: Example recordings from GFP−GFP− (red) and GFP+GFP+ (green) connections. Bottom: Average amplitudes of uEPSPs (1, 2–8 and R) in GFP−GFP− (red; n = 6) and GFP+GFP+ (green; n = 7) connections. Data were analyzed by two-tailed Mann–Whitney U-test (uEPSP1: U = 1, **P = 0.0051; uEPSP2–8: U = 3, *P = 0.017; uEPSPR: U = 7, P = 0.0653). d, uEPSP1 example recordings and averaged amplitudes for GFP−GFP− (left; one-tailed paired Wilcoxon signed-rank test with Bonferroni correction; W = 0, P = 0.031, n = 6 connections) and GFP+GFP+ (right; W = 4, P > 0.05, n = 4 connections) at baseline (blue) and after the Hebbian protocol (yellow). Bar graphs show mean + s.e.m. Recordings were made in 5- to 6-week-old Sprague–Dawley rats of both sexes.

