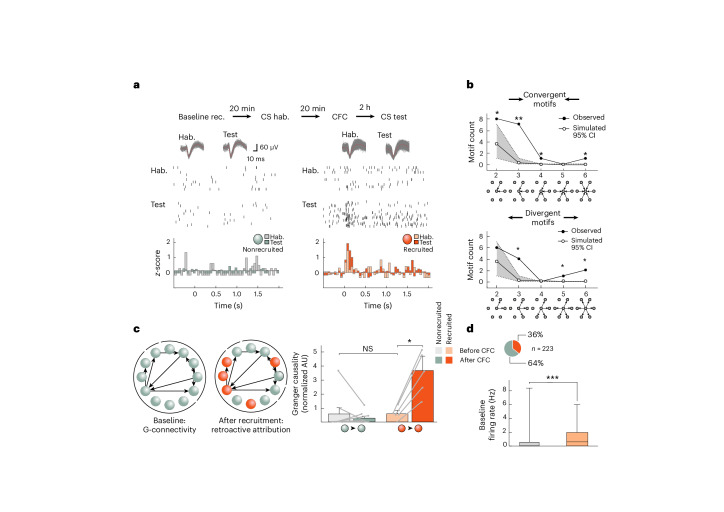
Fig. 6. In vivo connections and plasticity between LA neurons.
a, In vivo recordings (rec.) of neuronal spiking before (light colors) and 6 h after (dark colors) CFC (n = 7 rats). Top: Examples of neuronal spiking and CS+-evoked z-scores (after CFC) of recruited (orange) and nonrecruited neurons (gray); hab., habituation. b, Distributions of simulated (white, Monte Carlo; see Methods and Supplementary Note 3) and observed (black) connectivity patterns. The gray area around the central line indicating simulated values represents the 95% confidence interval. Single asterisks and double asterisks indicate observed values outside the 95% and 99% confidence intervals, respectively. c, Left: Connectivity diagrams before and after CFC. Right: Granger causality strength (normalized) for nonrecruited (n = 8) and recruited (n = 5) connections. Data were analyzed by one-tailed paired Wilcoxon signed-rank tests (nonrecruited: W = –3, P > 0.05; recruited: W = 15, *P < 0.05 and P = 0.06 (not significant (NS)) after Bonferroni correction for multiple comparisons). Note the similar causality strength before CFC between nonrecruited and recruited neurons. Data were analyzed by one-tailed Mann–Whitney U-test; U = 10). Bars show mean ± s.e.m. d, Top: Distribution of neuronal recruitment. Bottom: Box plot (median, middle line; 25% and 75% quartiles; whiskers, maximal and minimal values) showing a higher baseline firing rate in future recruited neurons (red). Data were analyzed by two-tailed Student’s t-test (t = 7.27, d.f. = 221, n = 143 (nonrecruited) and 80 (future-recruited) neurons, ***P = 0.0002). Recordings were acquired in 5- to 6-week-old Sprague–Dawley rats of both sexes.

