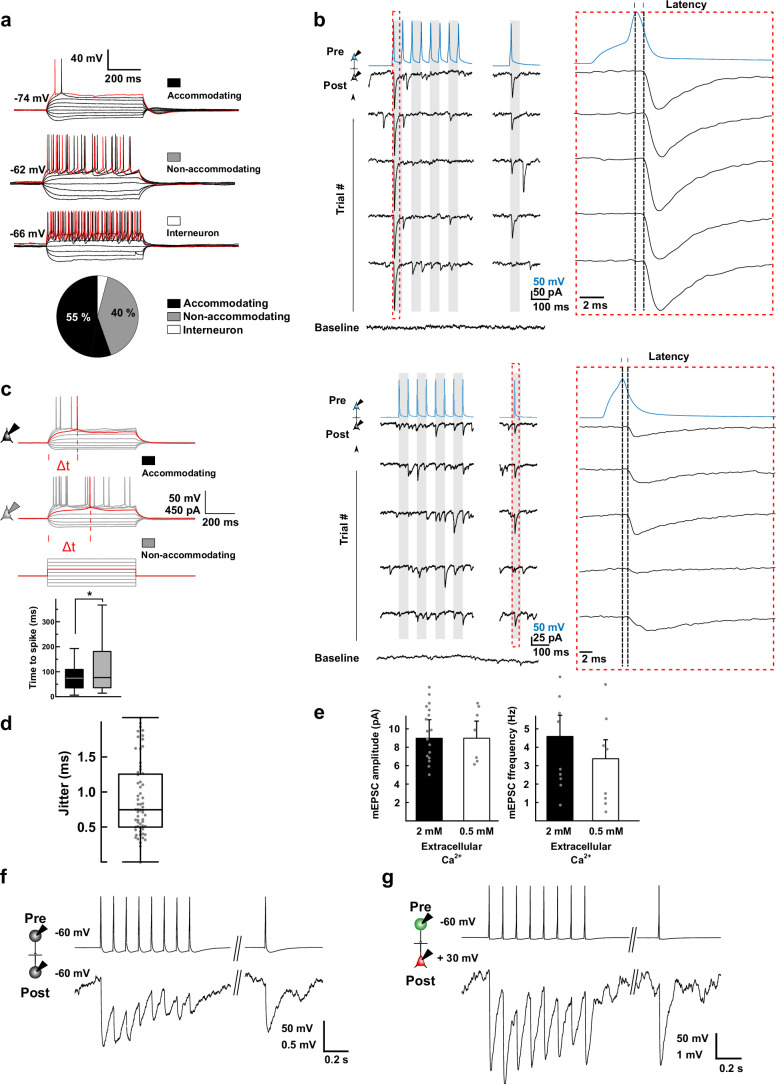
Extended Data Fig. 1. Electrophysiological characterization of neurons and connections.
a, Examples of neuronal response patterns to 400 ms square-pulse current injection steps (50 pA), with pie chart for distribution of recorded neuron types (n = 637 neurons). Red trace represents the first current injection that triggered an action potential. b, Example of voltage-clamp recording with a confirmed connection between presynaptic (blue) and postsynaptic (black) neuron that was depressing (top) or facilitating (bottom); APs were elicited presynaptically (blue) and unitary excitatory postsynaptic currents (EPSCs) recorded postsynaptically (black; 5 example traces are shown); red box inset: time-scale expansion showing that uEPSC selection was time-locked to presynaptic AP peak, with a fixed latency between 0.5 to 4.5 ms. c, The time to spike was used as a measure of the degree of accommodation for recorded neurons, measured as the delay (Δt) to observe the first action potential upon application of minimal current injection (400 ms square pulse); Time to spike of shorter duration for accommodating neurons (top example trace) when compared to non-accommodating neurons (bottom example trace). Bar graph, Time to spike was shorter for accommodating when compared to non-accommodating neurons; Student’s t-test with Welch correction. t = -2.0386, df = 53.205, P = 0.04647 (*), n = 40 vs 59 neurons. Box plot indicates mean (central line), 25 and 75% interquartile, and maximum and minimum values (whiskers). d, Jitter for monosynaptic connections (n = 81). Box plot mean represents the median and whiskers represent the inter-quartile range x 1.5. e, External Ca2+ concentration does not influence mEPSC amplitude, whereas EPSC frequency tends to decrease with lower [Ca2+], indicating presynaptic modulation of vesicle release. n = 17 and 8 connections for 2 mM and 0.5 mM extacellular Ca2+, respectively. f, Example trace of one of 21 inhibitory neurons that were found in naïve slices (from rats not subjected to fear conditioning) exhibiting high spiking frequencies (>30 Hz) and high cell membrane resistances (1140 ± 114 MΩ). 12 of these made local connections, all of which were inhibitory, as shown as amplitude IPSPs, thus confirming the validity of these electrophysiological criteria to identify local interneurons. Current clamp, with baseline at -60 mV for both pre- and postsynaptic neurons. Average of 15 traces. g, Example trace of one out of 18 inhibitory neurons found among CFC-recruited Arc+ (GFP+) neurons, (same criteria as for f), 4 of these made local connections with non-recruited pyramidal neurons; all of these were again inhibitory. Current clamp, with baseline at -60 mV for the presynaptic neuron and +30 mV for the postsynaptic neuron (to increase observed inhibitory postsynaptic potential amplitude). Average of 15 traces.

