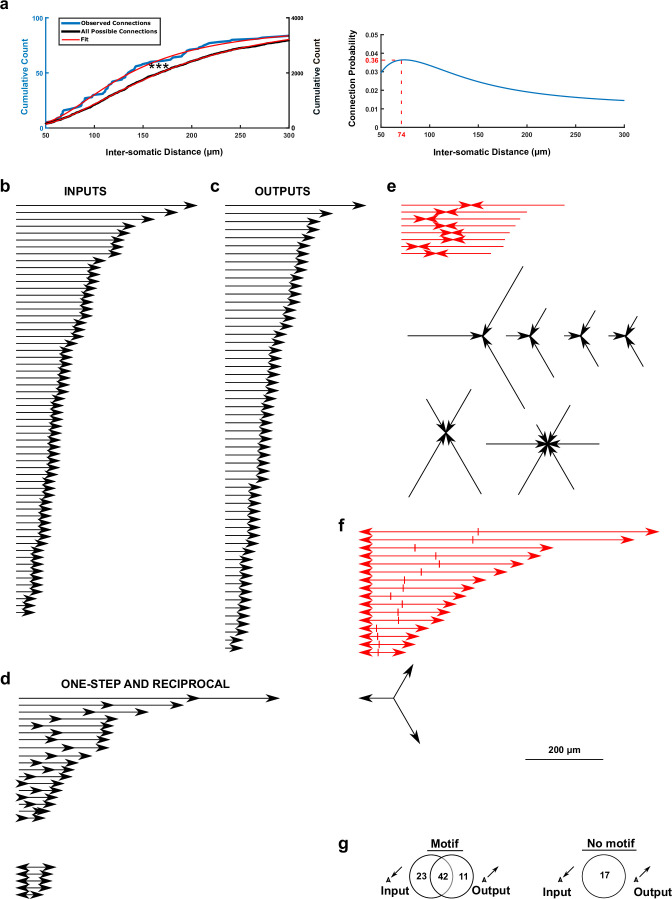
Extended Data Fig. 2. Inventory of connection distances categorized by motif.
a, Left: Cumulative count of inter-somatic distances of observed (blue) and all possible connections (black). The respective fits (red) indicate a statistically significant left-shift for the inter-somatic distances of the observed connections (Kolmogorov-Smirnov test, D = 0.42, P < 0.0001 (***)). Right: The ratio of the derivatives yielded the connection probability as a function of inter-somatic distance, revealing a high connectivity (>5%) for cell bodies within 100 µm. b-f, List of all observed connection distances (connection distance includes arrow tip) for b, single inputs, c, single outputs, d, one-step feed-forward (top) and reciprocal (bottom) motifs, e, convergent input motifs and f, divergent outputs motifs. For the red-marked motifs, the summed distance of double-convergent motifs (295 ± 20 μm) is similar to the summed distance of double-divergent motifs (335 ± 48 µm; Two-sided Welch two-sample t-test, t19.4 = 0.8, P = 0.4493; ± SD), but the variance of the summed distance is an order of magnitude lower for double-convergent motifs, at 3241 μm2, compared to that of double-divergent motifs, at 37145 μm2 (Bartlett test of homogeneity of variances, K2 = 9, P = 0.027). This suggests that convergent inputs define a local-cluster limit (within a ~ 300 µm radius) for local processing, whereas divergent outputs can be found both locally and distantly for processing of both intra- and inter-cluster information. Scale bar applies to b-f. g, Venn diagrams depicting single inputs and single outputs that were part (left) or not part (right) of non-convergent respectively non-divergent motifs. In total, more than >75% (=(23 + 42 + 11) / (23 + 42 + 11 + 17)) connections were part of a motif.

