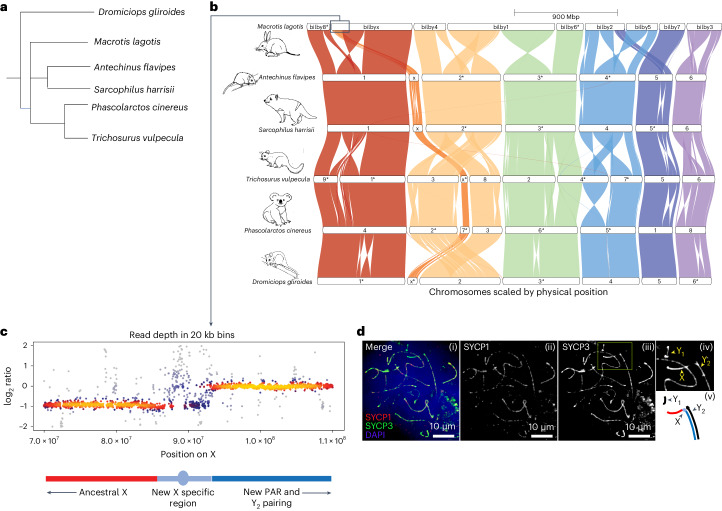
Fig. 4. Synteny map showing differences in marsupial chromosomes including the bilby XY1Y2 chromosome.
a, Indicative phylogeny of marsupial species included in the synteny map. b, Genespace synteny plots. Coloured blocks represent chromosome scaffolds for each species. Chromosomes are ordered to maximize visual synteny relative to neighbouring genomes, with the Ninu chromosomes defining the starting order and orientation. Each chromosome is labelled with the species and chromosome number (or X), with an asterisk when reversed to minimize inversions. c, Heatscatter of read depth ratios (relative to the pseudo-autosomal region (PAR) mean) of male genome sequence data in 20 kb bins of the compound X, demarcated into the ancestral X at half read depth, new X-specific region and a large PAR with full read depth that pairs with the Y2 during male meiosis. d, Representative image of Ninu primary spermatocyte stained by immunofluorescence with DAPI, SYCP1 and SYCP3 (i–iii), along with an inset depicting sex chromosomes (iv) and a model of sex chromosome pairing (v). The arrows indicate the position of sex chromosomes, with colours matching c. Scale bar, 10 μm/2 μm. The experiment was repeated twice.

