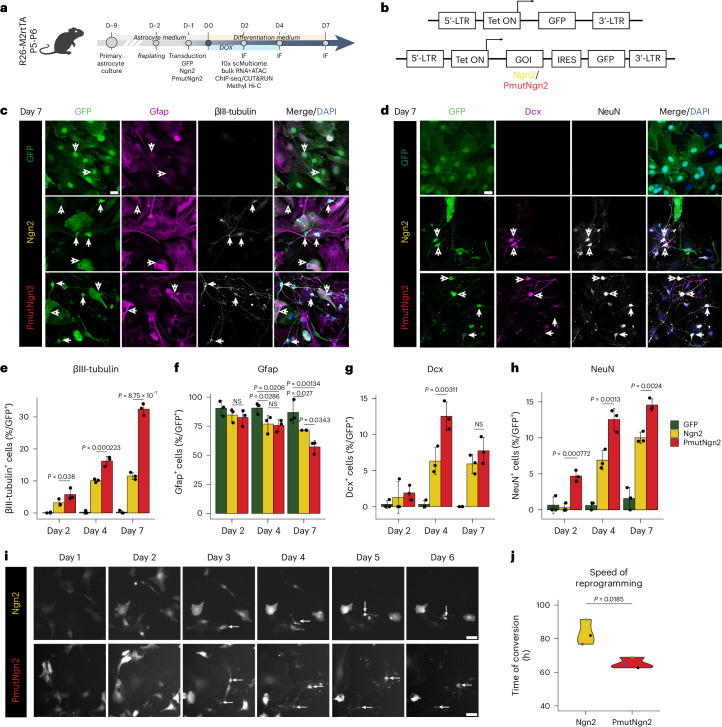
Fig. 1. PmutNgn2 accelerates mouse astrocyte-to-neuron reprogramming.
a,b, Scheme of the experimental design (a) and the lentiviral constructs (b) used in the study. c,d, Representative micrographs of astrocytes immunostained as indicated on top of the panels at 7 dpi for the experimental condition indicated on the left. Scale bar, 20 µm. In c, the filled arrows mark the iNs, and the empty arrows mark cells lacking neuronal markers (n = 3, biologically independent samples). In d, the filled arrow marks mature iNs (NeuN+Dcx−), and the empty arrow marks immature iNs (NeuN+Dcx+) (n = 3, biologically independent samples). e–h, Histograms showing percent of βIII-tubulin+ (e), Gfap+ (f), Dcx+ (g) and NeuN+ (h) cells among transduced cells (y axis) over time (x axis). Data are plotted as mean ± s.e.m.; each dot represents an individual biological replicate (n = 3). i, Micrographs show example frames of a continuous live-imaging experiment for the indicated experimental conditions across the indicated timescale. Scale bar, 50 µm. j, Violin plot showing the first timepoint when tracked cells showed a neuronal morphology; each dot represents a biological replicate (n = 3). Statistical significance was calculated using a linear regression model (e–h,j). D, day; NS, not significant; IF, immunofluorescence.

