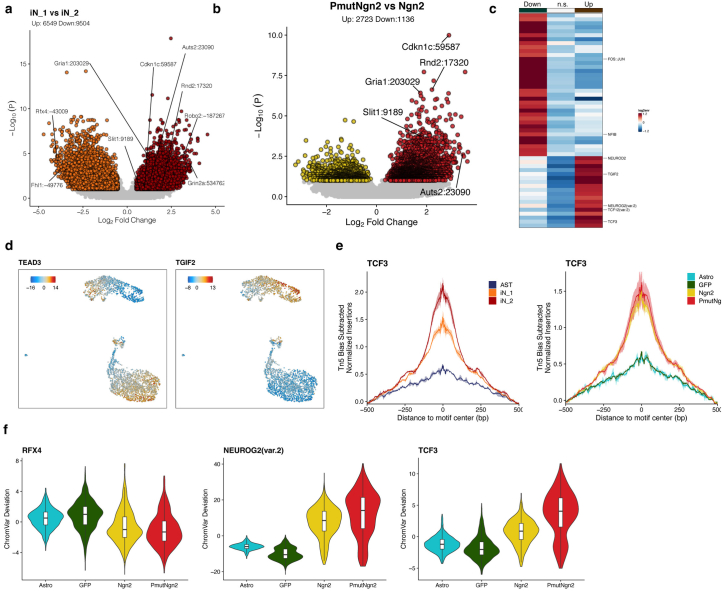
Extended Data Fig. 3. Chromatin accessibility characteristics of induced neurons.
(a-b) Volcano plot depicting the differentially accessible regions (DARs) (pseudobulk chromatin accessibility at ATAC peaks from multiome data) identified from a pairwise comparisons. (c) Heatmap depicting the log2-fold enrichment of TF motifs in the DARs. (d) UMAP visualization of TF motif activity of the indicated TFs. (e) Motif footprint of Tcf3 normalized for Tn5 insertion bias at the scATAC peaks in the indicated cell type clusters (left) or experimental condition (right). (f) Boxplots depicting the ChromVar deviation values for the indicated TFs in the indicated experimental conditions (n = 708, 708, 732 and 311 cells per condition respectively). Boxplots display median (line), 25th or 75th percentiles (box) as well as 10th or 90th percentiles (whisker).

