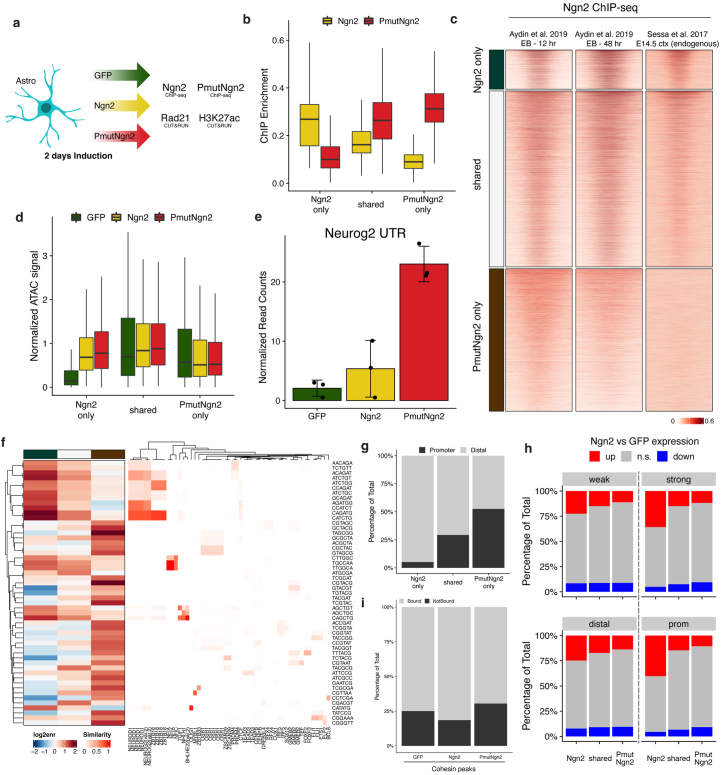
Extended Data Fig. 4. Ngn2 and PmutNgn2 binding remodels chromatin.
(a) Schematic representation of the experimental setup (b) Boxplots depicting the ChIP-seq enrichment in reads per million (RPM) at the indicated peak groups (n = 5655, 25352 and 20552 regions respectively). (c) Heatmaps showing ChIP-seq around differentially bound or shared Ngn2/PmutNgn2 peaks. (d) Boxplots depicting normalized accessibility (RPM) at the indicated peak groups (n = 5655, 25352 and 20552 regions respectively). (e) Barplots with mean ± s.d. showing the normalized read counts mapping to either the 5’ or the 3’UTR of the endogenous Ngn2 locus. Dots represent individual biological replicates (n = 3) (f) Heatmaps depicting kmer enrichment in the peak groups shown in Fig. 4a,b, as well as the closest matching TF motif based on similarity. (g) Percentage overlap between peaks and gene promoters ( ± 5 kb from TSS). (h) Percentage of differentially regulated genes (based on bulk RNA-seq) overlapping with different peak categories or genomic features. (i) Percentage of Ngn2/PmutNgn2 peaks overlapping with Rad21 (Cohesin) peaks in the corresponding condition. All boxplots display median (line), 25th or 75th percentiles (box) as well as 10th or 90th percentiles (whisker).

