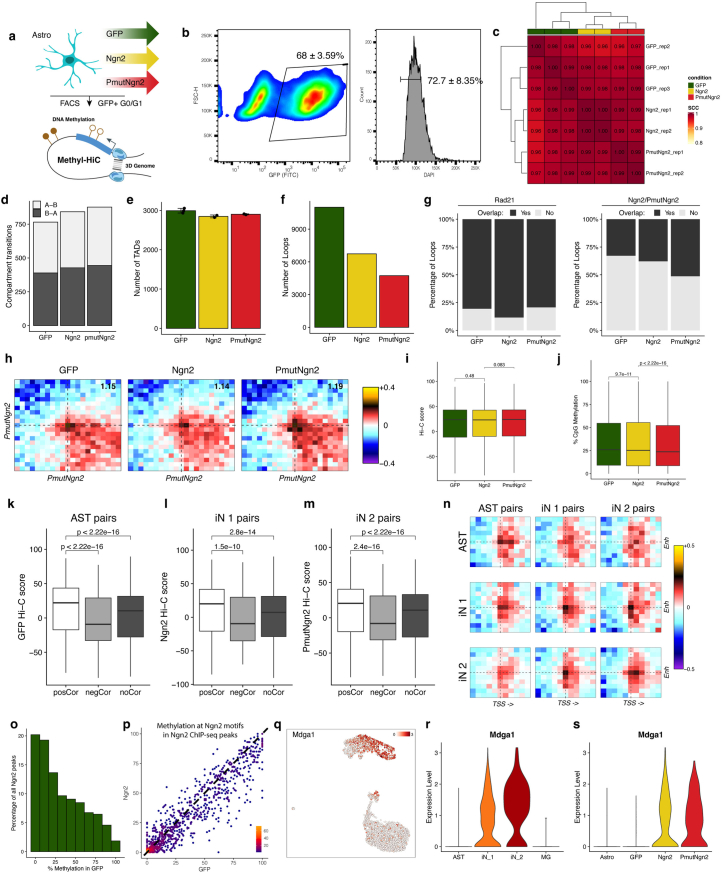
Extended Data Fig. 5. Ngn2 and PmutNgn2 rewire the 3D genome.
(a) Schematic representation of the methyl-HiC experimental strategy (b) FACS gating strategy for sorting transduced (GFP + ) cells in the G0/G1 cell cycle stage. (c) Pairwise correlation matrixes displaying 3D genome correlation coefficient (stratum adjusted correlation coefficient, 50 kb bins, calculated by HiCRep). (d) Stacked bar plots depicting compartment transitions. (e) Barplot showing the number of TADs per condition (n = 3, 2 and 2 biological replicates for GFP, Ngn2 and PmutNgn2 respectively). Data is represented as mean ± s.d. and individual values are shown as dots. (f) Barplot showing the number of chromatin loops per condition (FDR < = 0.1). (g) Stacked barplots showing the percentage overlap between Rad21 or Ngn2/PmutNgn2 peaks and loop anchors. (h) Aggregated Hi-C plots between intra-TAD pairs of the top 5000 PmutNgn2 peaks. (i) Quantification of the interaction strength of intra-TAD contact pairs depicted in (h) (n = 7036 pairs). Statistical significance is calculated using a two-sided, paired Wilcoxon rank-sum test. (j) Quantification of the average DNA methylation at the distal regions within the top PmutNgn2 distal sites (n = 4141). Statistical significance is calculated using a two-sided, paired Wilcoxon rank-sum test. (k-m) HiC scores measured in AST, iN 1 or iN 2 between cluster-specific positive (posCor), negatively (negCor) or non-correlated (noCor) enhancer-gene pairs. Statistical significance is calculated using a two-sided, unpaired Wilcoxon rank-sum test. Number of regions per category are indicated directly at the plot. (n) Aggregated Hi-C maps between the linked distal peak and the transcription start site (TSS) of cluster specific enhancer-gene pairs. Genes are oriented according to transcription. (o) Histogram depicting the percentage of methylation in the GFP methyl-HiC condition at Ngn2 ChIP-seq binding sites. (p) Density scatter plot showing the level of DNA methylation at Ngn2 motifs within Ngn2 ChIP-seq peaks. (q) Expression levels of Mdga1 visualised on joint UMAP projection. (r-s) Violin plot depicting the expression levels of Mdga1 in the indicated cell-type clusters or conditions. All boxplots display median (line), 25th or 75th percentiles (box) as well as 10th or 90th percentiles (whisker).

