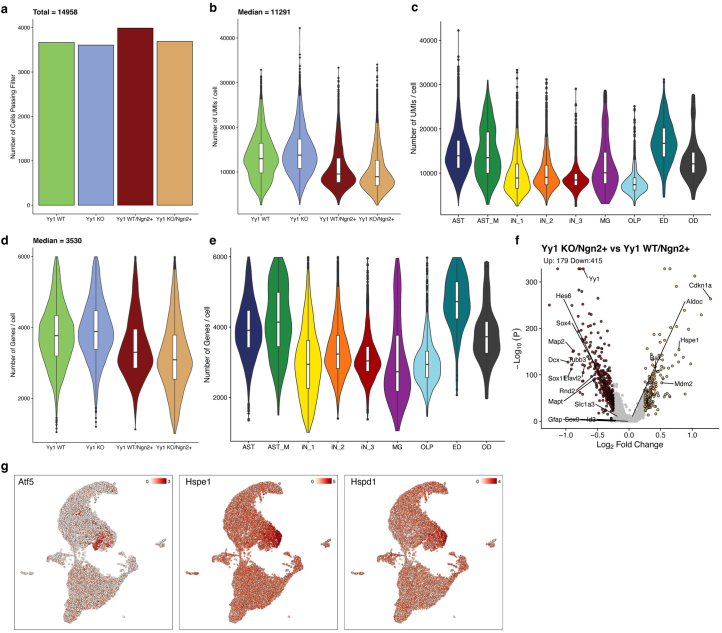
Extended Data Fig. 6. Yy1 is required for successful mouse astrocyte-to-neuron conversion.
(a) Bar plot showing the number of cells per experimental condition that passed the quality control filters and were used for downstream analysis. (b) Violin and box-whisker plot depicting the number of UMIs per cell for each experimental condition (n = 3666, 3608, 3991 and 3693 cells per condition respectively). (c) Same as d, but for each annotated cell-type cluster (n = 6790, 338, 2378, 3691, 835, 175, 444, 208 and 99 cells per cluster respectively). (d) Violin and box-whisker plot depicting the number of genes per cell for each experimental condition (n = 3666, 3608, 3991 and 3693 cells respectively). (e) Same as f, but for each annotated cell-type cluster (n = 6790, 338, 2378, 3691, 835, 175, 444, 208 and 99 cells per cluster respectively). (f) Volcano plot showing the differentially expressed genes for the following pairwise comparison, Yy1_KO/Ngn2+ vs Yy1_WT/Ngn2. Yellow, red, and grey dots represent the up-, down- and non-regulated genes. (g) UMAP visualization of the expression levels of the indicated marker genes. All boxplots display median (line), 25th or 75th percentiles (box),10th or 90th percentiles (whisker) and outliers (dots).

