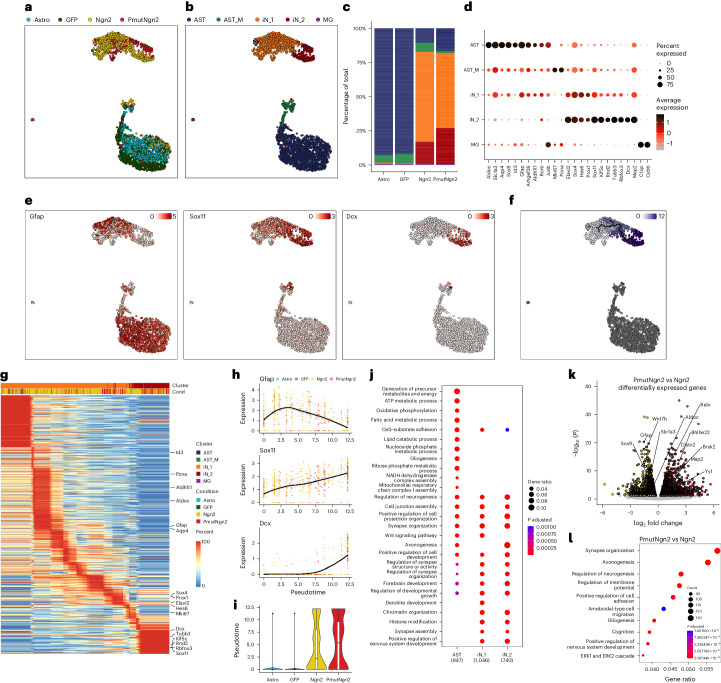
Fig. 2. Gene expression differences elicited by Ngn2 and PmutNgn2.
a,b, Joint (single-cell RNA + single-cell ATAC) UMAP projection, where murine cells are colored based on the experimental condition (a) or their cluster identity (b). c, Stacked bar plot representing the relative proportion of the identified cell types in each experimental condition. d, Dot plot showing the proportion of cells (as a percentage, size of dots) and the gene expression levels of selected marker genes (color) in the respective cell type clusters. e, UMAP visualization of the expression levels of indicated markers genes. f, UMAP visualization of the inferred neuronal maturation trajectory and the corresponding pseudotime. g, Heatmap depicting the expression levels of the most variable genes across maturation pseudotime. h, Gene expression changes of the indicated marker genes across the maturation pseudotime. Each dot depicts the expression level per cell of the given gene across pseudotime; the color indicates the experimental condition identity; and the line represents a smoothed fit of the gene expression values across pseudotime. i, Box plots depicting the pseudotime values per condition (n = 708, 708, 732 and 311 cells, respectively). Shown are the median (line), 25th or 75th percentiles (box) and 10th or 90th percentiles (whiskers). j, Bubble plot depicting the enriched GO terms specific to the indicated clusters. Statistical significance was calculated using a Benjamini–Hochberg-adjusted hypergeometric test. k, Volcano plot depicting the differentially expressed genes (FDR < 0.05) from a pairwise comparison between PmutNgn2 versus Ngn2 using bulk RNA-seq (n = 3 biological replicates). l, Bubble plot showing the top 10 GO terms of the differentially regulated genes from a pairwise comparison between PmutNgn2 versus Ngn2 bulk RNA-seq.

