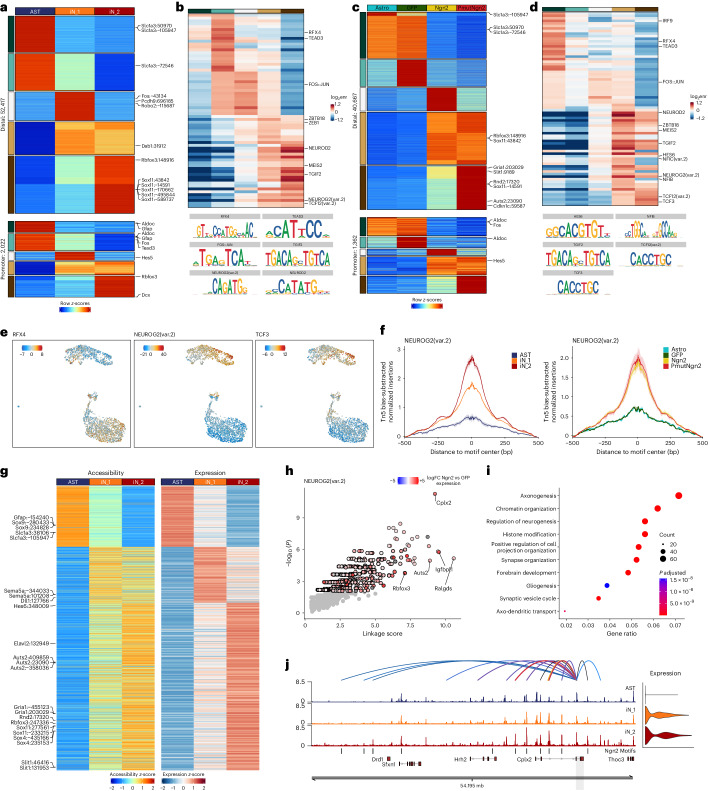
Fig. 3. Changes in regulatory landscape caused by Ngn2 or PmutNgn2.
a, Heatmap of the pseudobulk accessibility (z-scores) per murine cell type cluster of the differentially accessible sites in distal and promoter regions. b, Heatmap depicting the log2 fold enrichment of TF motifs in the five clusters identified by k-means clustering of the differentially accessible sites between cell types in distal and promoter regions. c, Same as a but for differentially accessible sites identified per experimental condition. d, Same as b but for TF motif enrichment in the clusters of differentially accessible sites identified per experimental condition. e, UMAP projection of motif activity scores for the indicated TFs. Scale bar represents the ChromVar motif deviation score. f, Motif footprint of NEUROG2(var.2) normalized for Tn5 insertion bias at the single-cell ATAC peaks in the indicated cell type clusters or experimental condition. g, Heatmaps depicting the aggregated accessibility of putative enhancer elements (left) and the expression levels of their linked genes (right) for positively correlated EGPs. h, Scatter plot depicting the predicted target genes of Ngn2 based on its motifs, with each dot representing a putative target gene. Significant genes are colored based on log fold change (FC) of expression between Ngn2 and the GFP condition (bulk RNA-seq). i, Bubble plot depicting the top 10 GO terms of the predicted Ngn2 target genes based on its motif. Color and size of circles indicate Benjamini–Hochberg-adjusted P value (hypergeometric test) and number of genes, respectively. j, Genome track showing aggregated single-cell ATAC accessibility and expression in the indicated experimental conditions at the Cplx2 locus. Values represent reads per million mapped reads (RPM). enr, enrichment.

