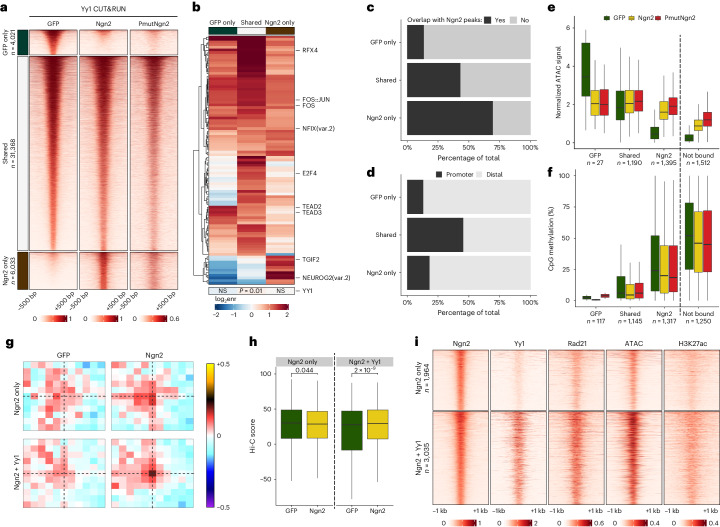
Fig. 6. Ngn2 and Yy1 synergize to alter the epigenetic landscape.
a, Heatmaps showing the enrichment of Yy1 CUT&RUN signal around differentially bound or shared peaks. b, Heatmap depicting the TF motif enrichment in the peak groups shown in a. c, Percentage overlap between Ngn2 peaks and either differentially bound or shared Yy1 peaks. d, Overlap of differential or shared Yy1 peaks with genomic features. e, Box plots depicting chromatin accessibility at the top 5,000 Ngn2 peaks overlapping differential or shared Yy1 peaks or not bound by Yy1. f, As in e but quantifying DNA methylation at the respective regions. Box plots display median (line), 25th or 75th percentiles (box) and 10th or 90th percentiles (whiskers). n indicates the number of regions in each category. g, Aggregated Hi-C plots between intra-TAD pairs of the top 5,000 Ngn2 ChIP-seq peaks, split by whether they overlap (Ngn2+Yy1) or not (Ngn2 alone) with Yy1. h, Quantification of the interaction strength of the pairs depicted in g. Statistical significance was calculated using a two-sided paired Wilcoxon rank-sum test (n = 1,038 and n = 3,035 pairs, respectively). Box plots display median (line), 25th or 75th percentiles (box) and 10th or 90th percentiles (whiskers). i, Heatmaps showing the enrichment of Ngn2, Yy1, Rad21, pseudobulk single-cell ATAC and H3K27ac signal around the same peaks as in g. Experiments were performed with murine cells. enr, enrichment; NS, not significant.

